EverZone Warehouse Descriptive Analytics
This report analyzes descriptive data from a warehouse called EverZone.
Create a free account
Save your favorite dashboards, get new templates by area and ask the AI assistant — for free.
About the EverZone Warehouse Descriptive Analytics dashboard
This is a free Power BI dashboard called EverZone Warehouse Descriptive Analytics, in the Logística domain. Explore KPIs, interactive visualizations and get inspired for your own data and business intelligence projects.
This report analyzes descriptive data from a warehouse called EverZone.
Dashboard analysis
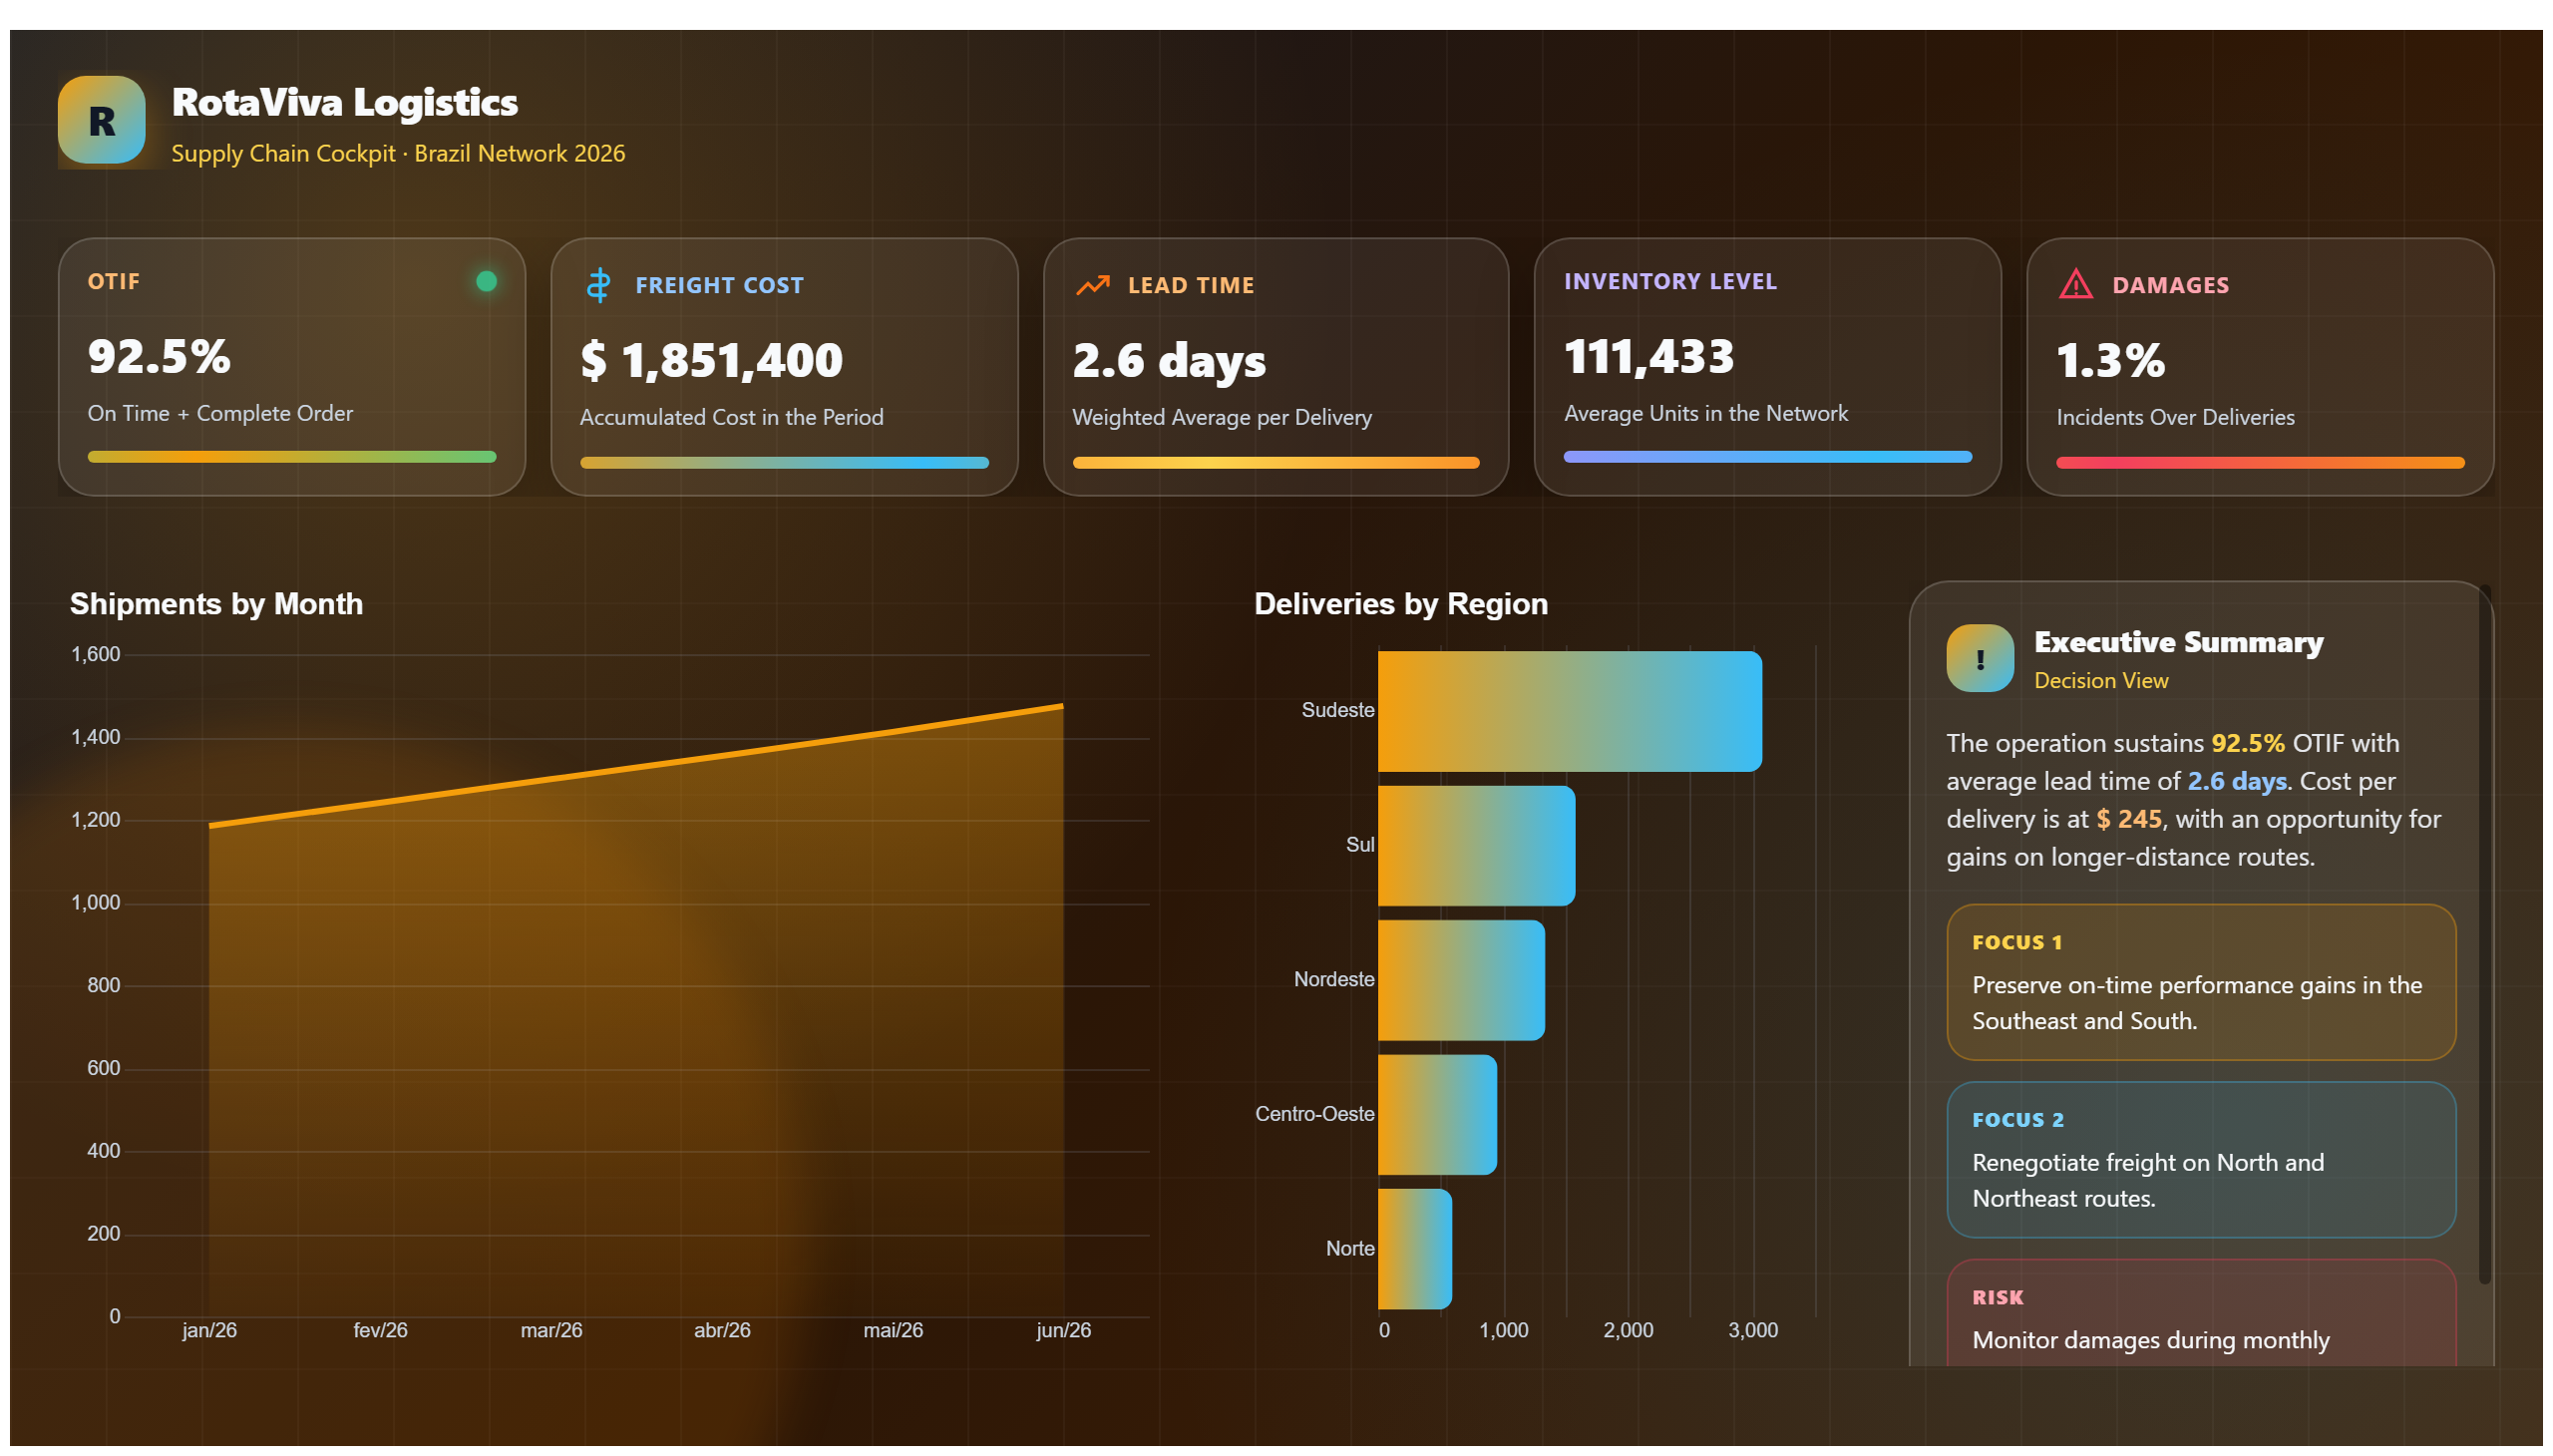
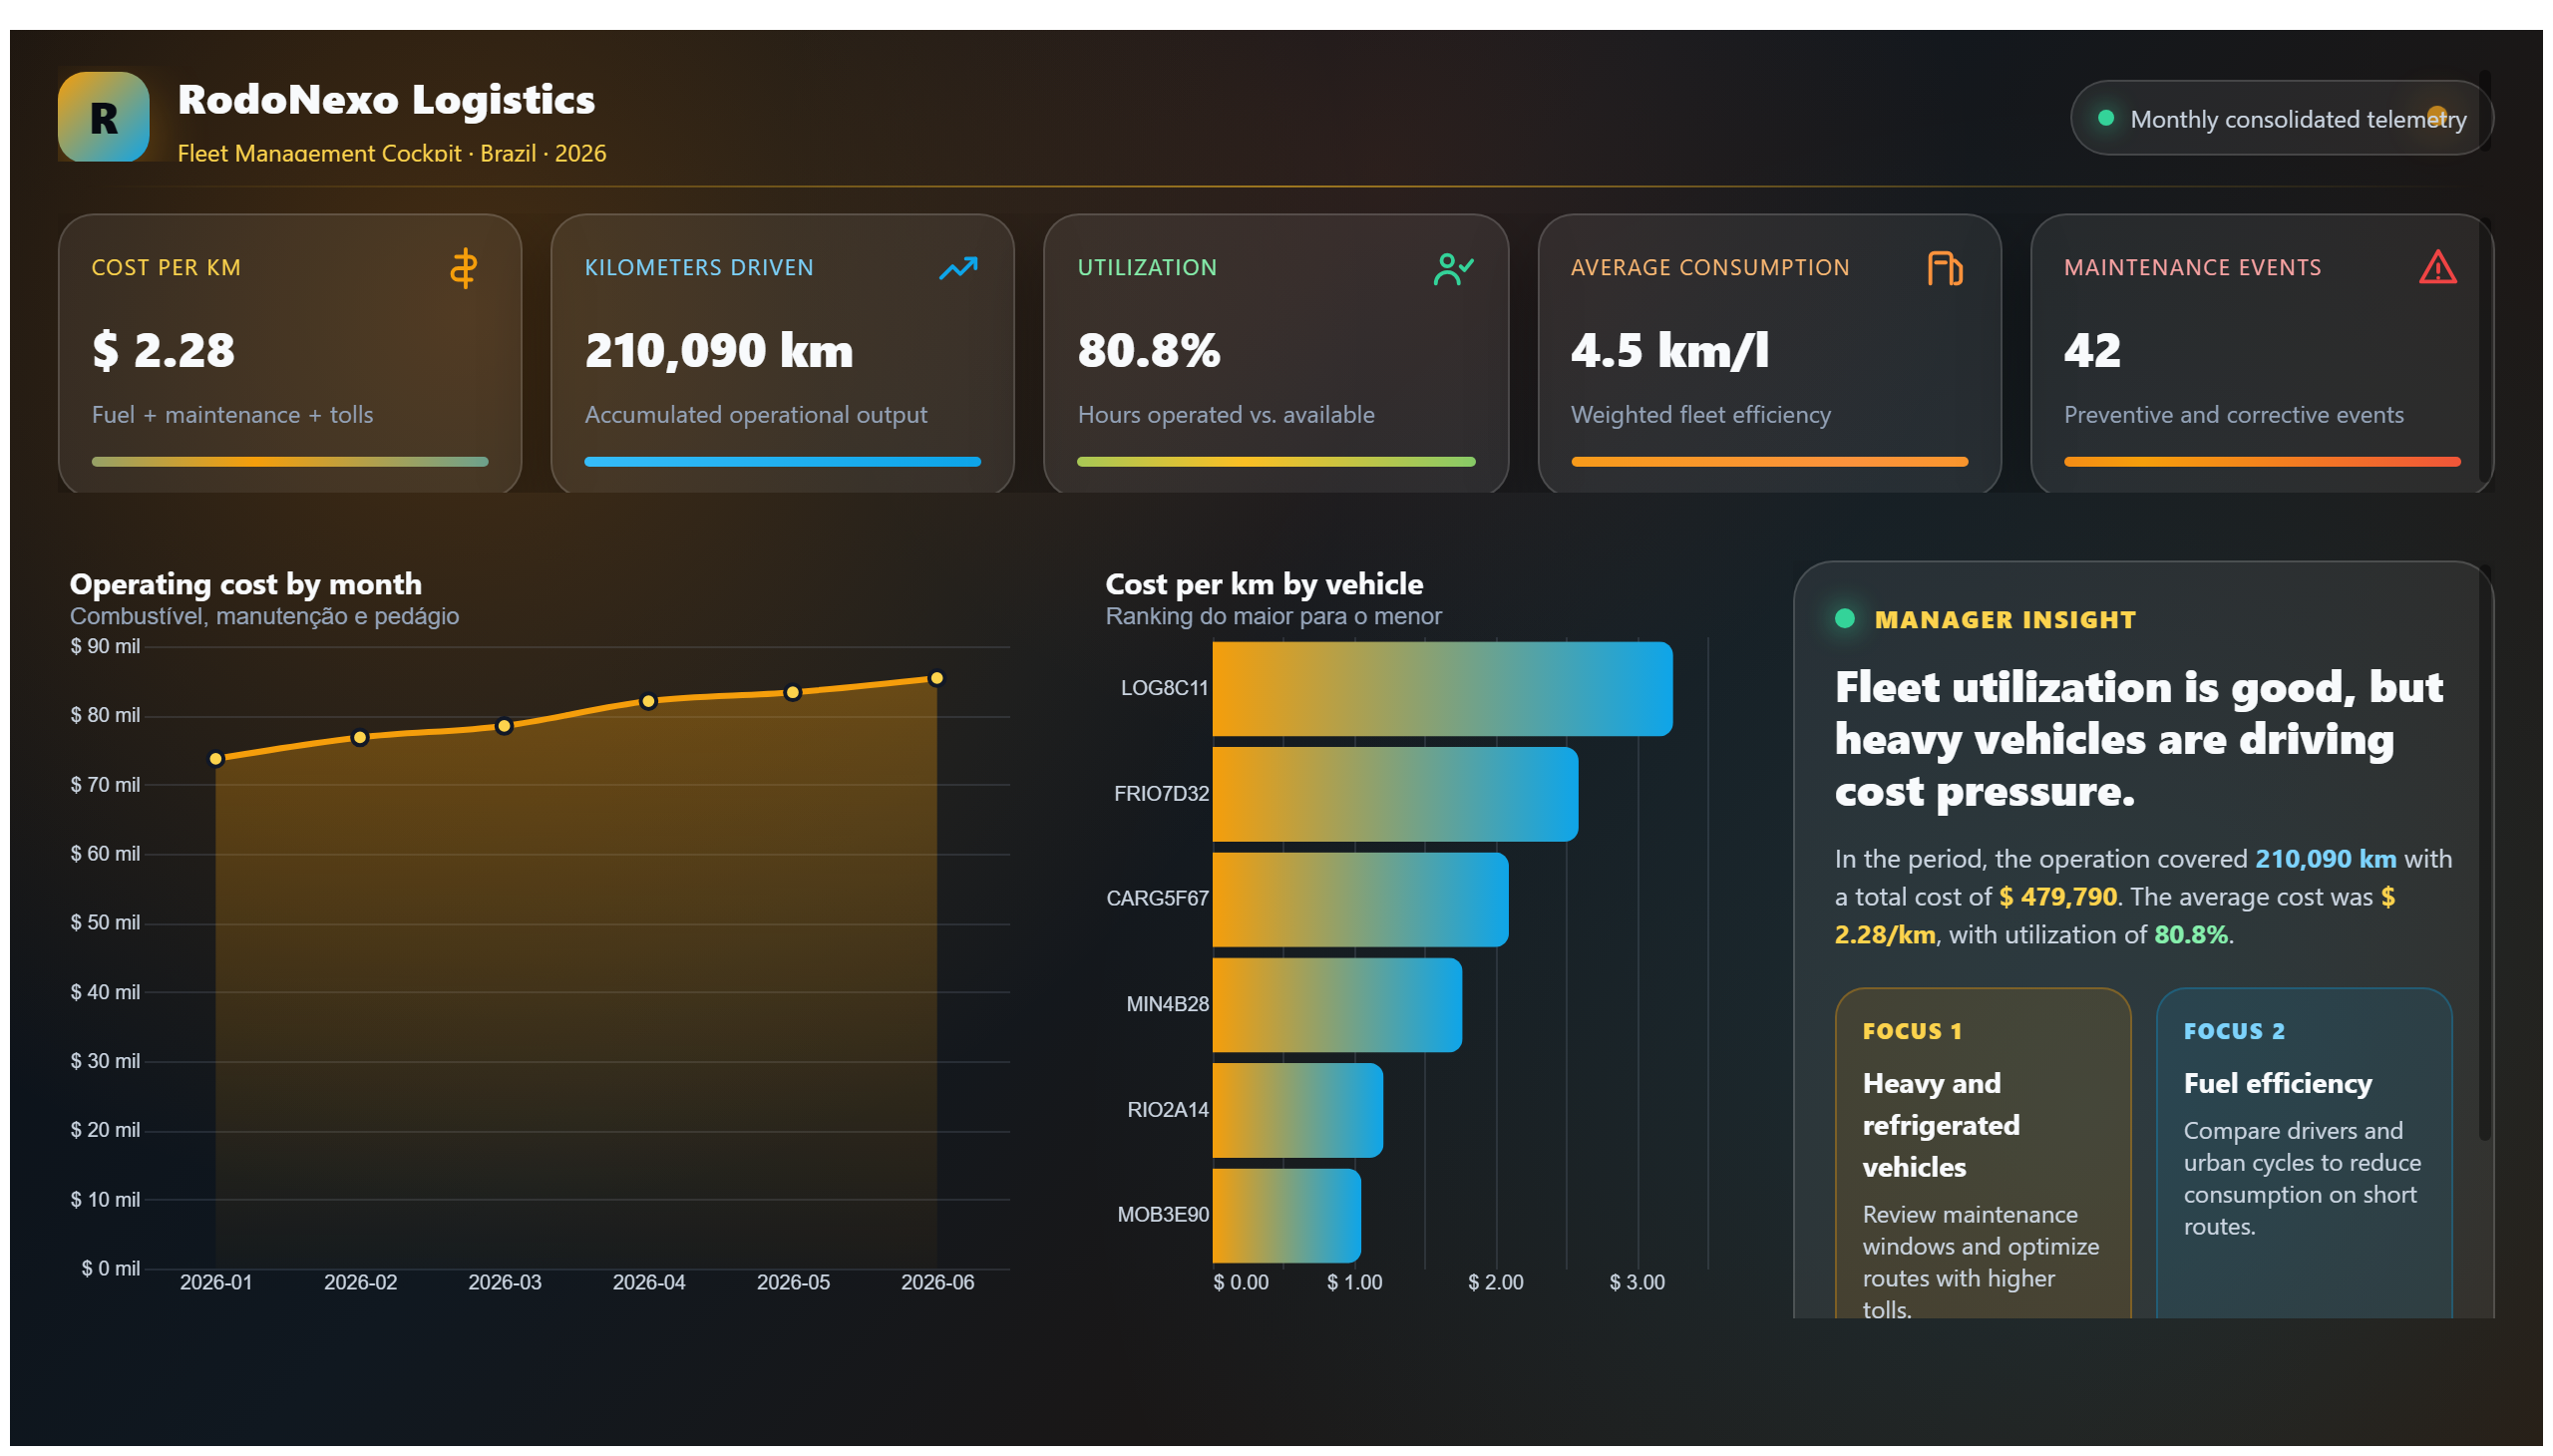
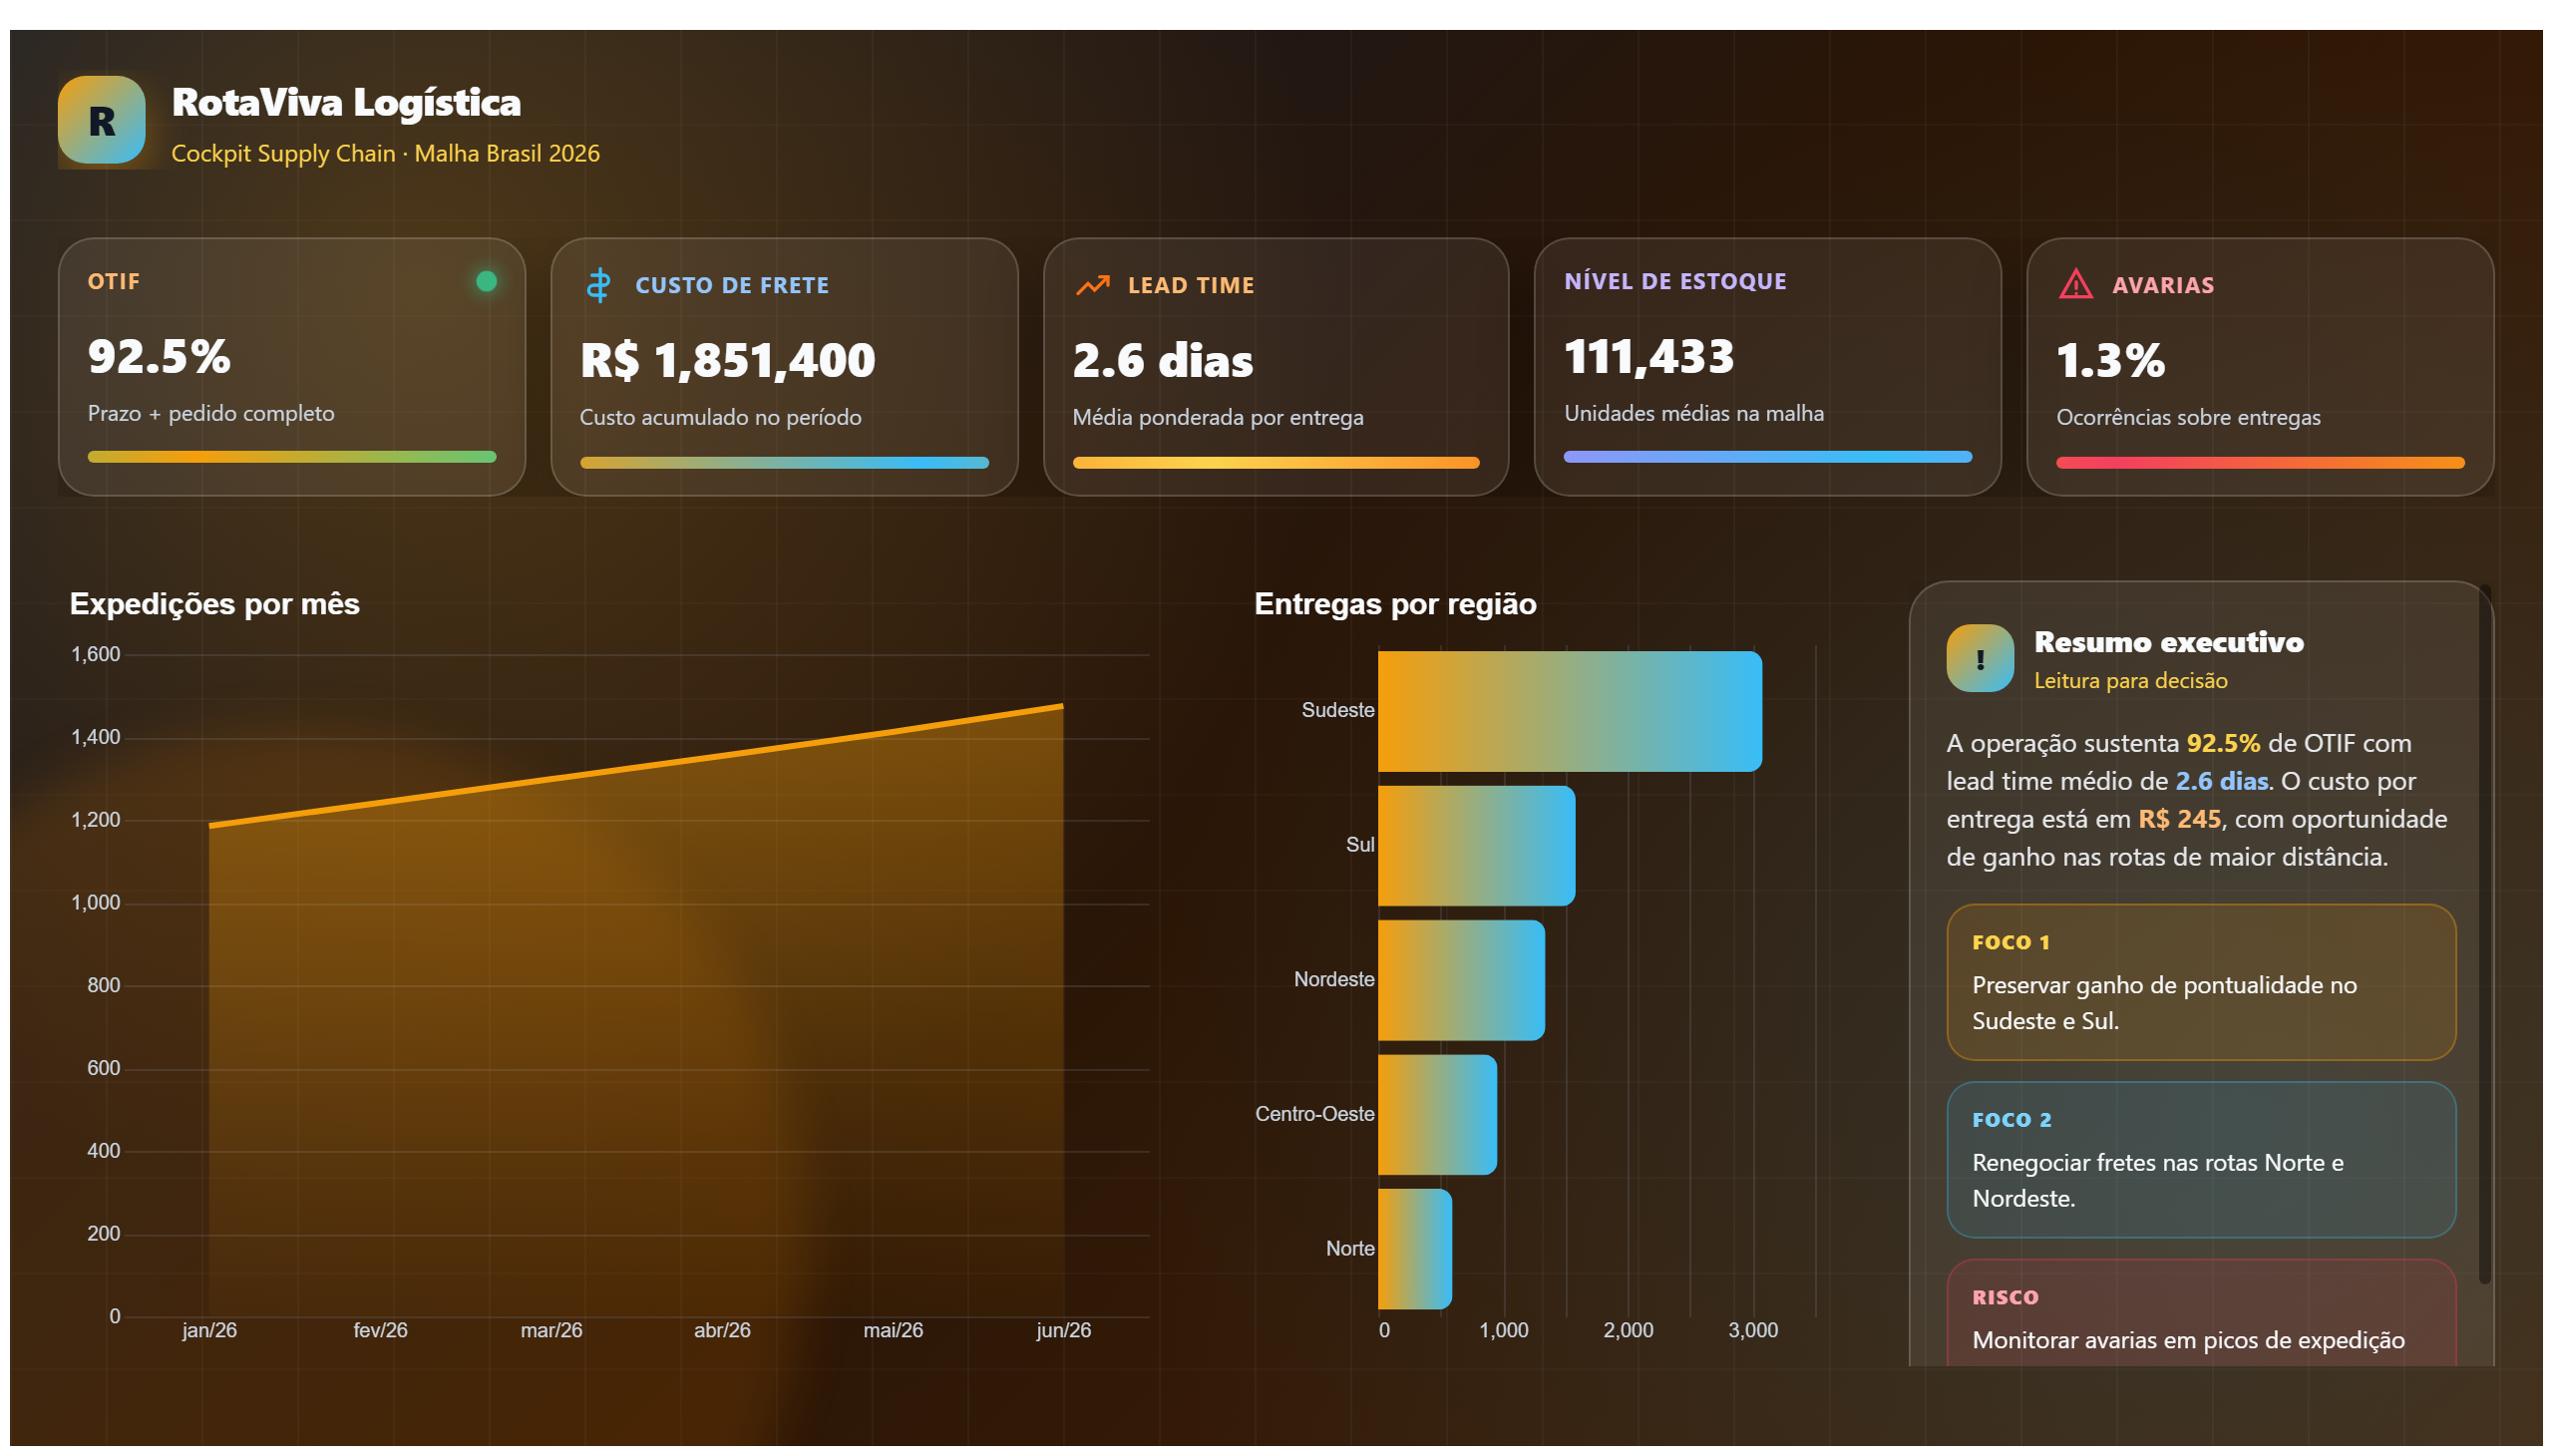
The EverZone Warehouse Descriptive Analytics dashboard provides a comprehensive overview of the operational data from the EverZone warehouse. It focuses on descriptive analytics to help users understand historical performance and current status across various warehouse activities. This dashboard is designed to answer key business questions such as inventory levels, order fulfillment rates, and throughput times, offering valuable insights into warehouse efficiency and resource utilization.
By visualizing critical metrics and trends, this report supports supply chain managers and warehouse supervisors in identifying bottlenecks, monitoring stock movements, and ensuring timely deliveries. The clear presentation of data enables stakeholders to make informed decisions aimed at optimizing warehouse operations, reducing delays, and improving overall supply chain performance.
Frequently asked questions about this dashboard
What type of data does the EverZone Warehouse Descriptive Analytics dashboard analyze?
It analyzes descriptive data related to warehouse operations, including inventory levels, order fulfillment, and throughput times.
Who is the primary audience for this dashboard?
The dashboard is primarily intended for supply chain managers and warehouse supervisors who need insights into warehouse performance.
What business questions can this dashboard help answer?
It helps answer questions about current inventory status, efficiency of order processing, and identification of operational bottlenecks.
Want a dashboard like this with your data?
We build a custom version for your business — US$ 50 per page, delivered within 7 calendar days.
Logistics Power BI templates
Complete projects built by the Excelverton factory: view them live with a free account and download the PBIP as a channel subscriber (1/month) or Pro subscriber (unlimited).
Create your free account
Save favorites, build collections and use the AI assistant — at no cost.