Courage Naapi
This report may be related to an educational project called Courage Naapi, focusing on feedback or results.
Create a free account
Save your favorite dashboards, get new templates by area and ask the AI assistant — for free.
About the Courage Naapi dashboard
This is a free Power BI dashboard called Courage Naapi, in the Educação domain. Explore KPIs, interactive visualizations and get inspired for your own data and business intelligence projects.
This report may be related to an educational project called Courage Naapi, focusing on feedback or results.
Dashboard analysis
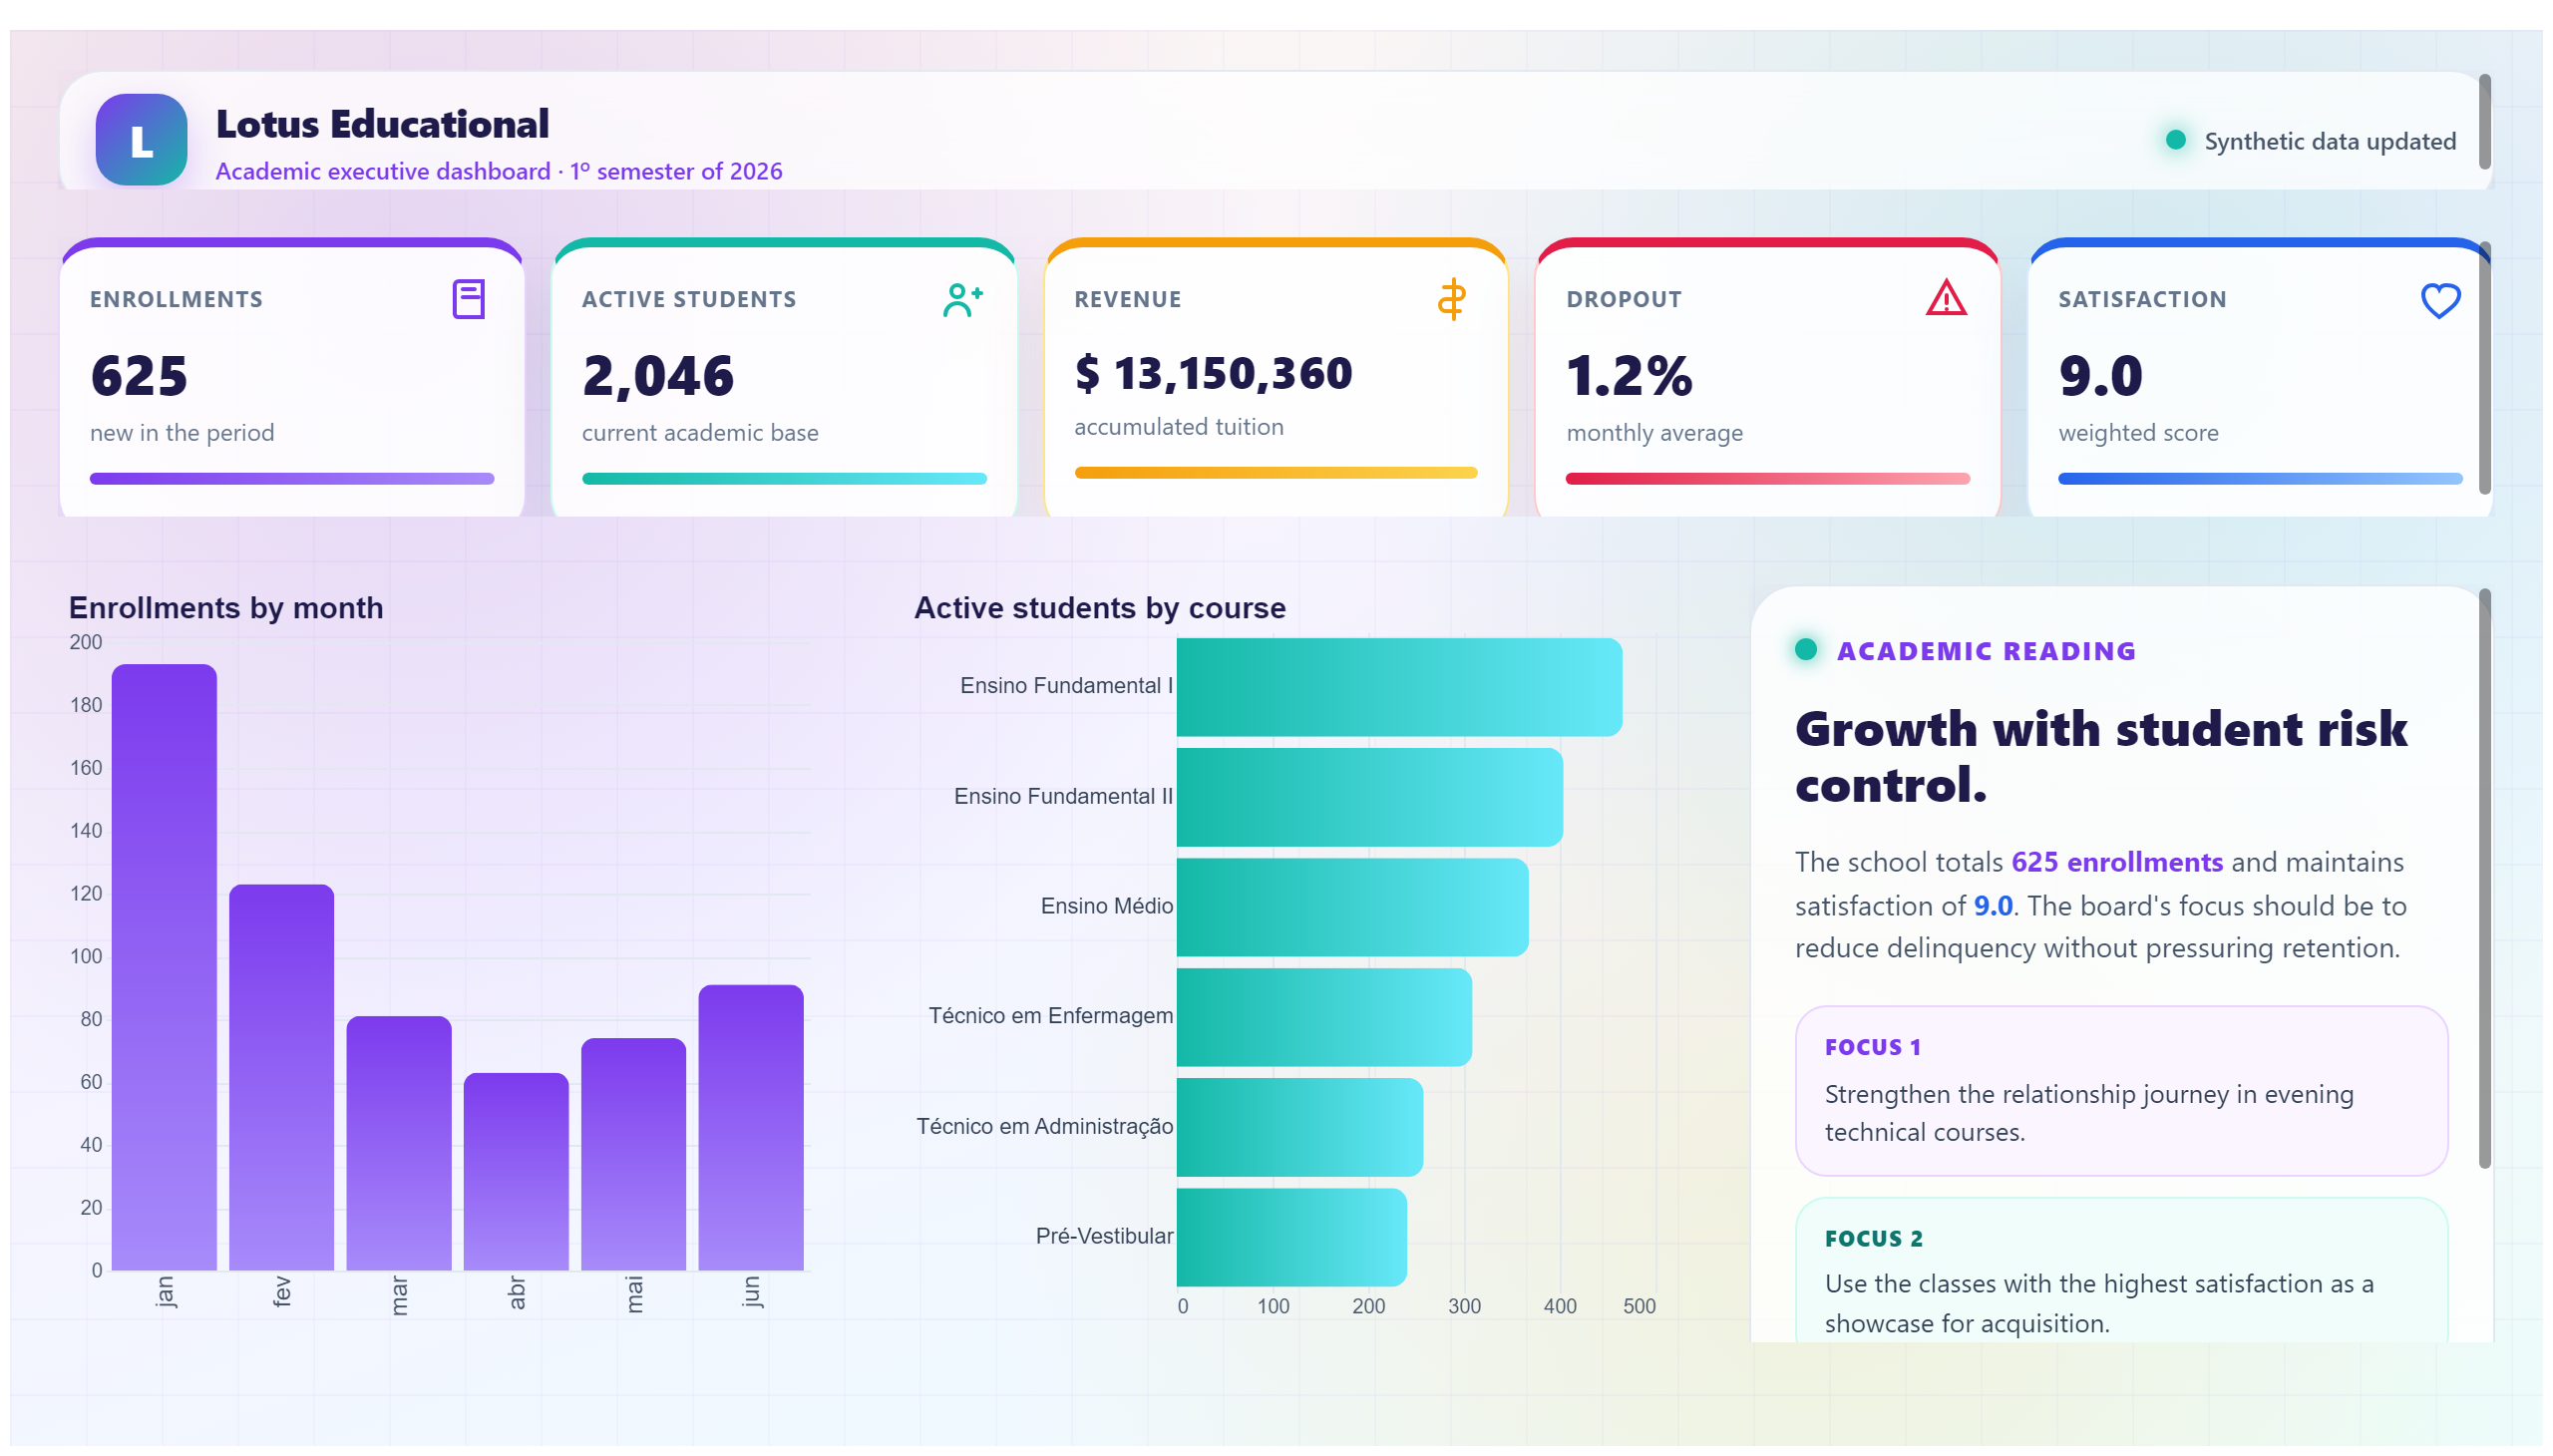
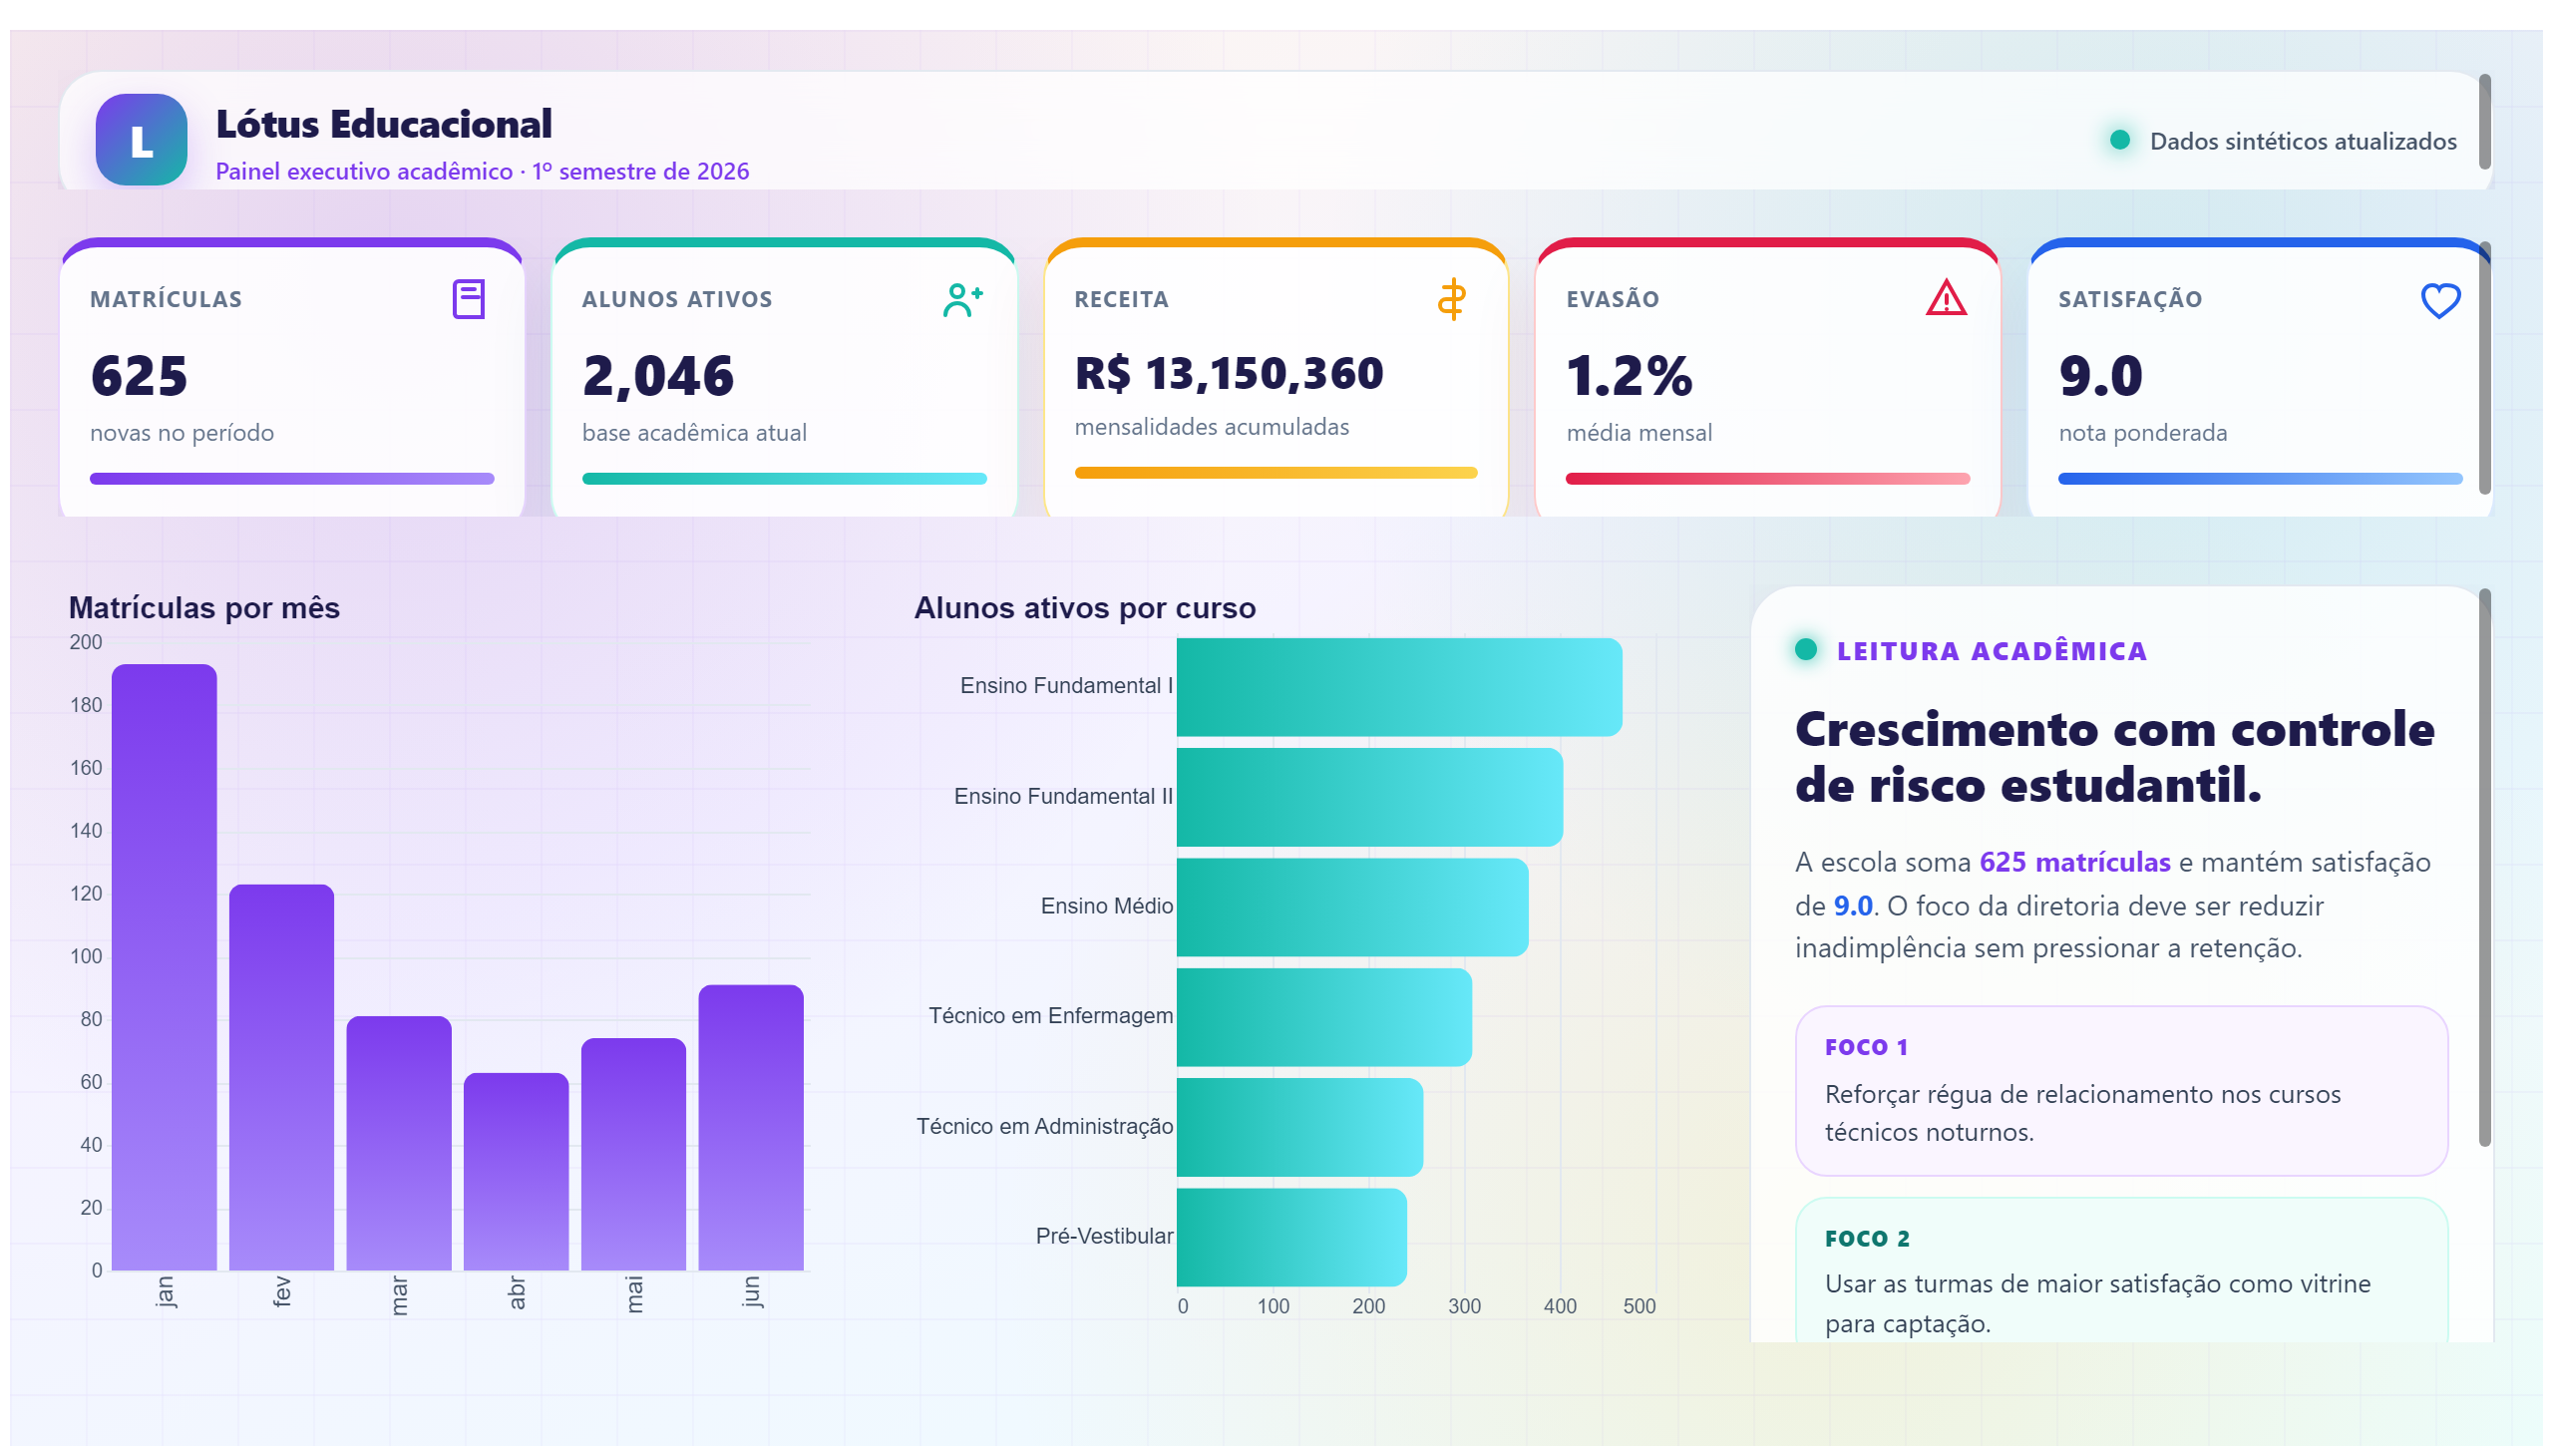
The Courage Naapi dashboard appears to be designed for an educational project named Courage Naapi, focusing on providing insights related to feedback or educational outcomes. This report likely aggregates and visualizes key performance indicators and qualitative feedback from participants or stakeholders involved in the project. By presenting this data in a clear and interactive manner, it allows educators and project managers to monitor progress, identify areas for improvement, and measure the impact of their initiatives.
This dashboard answers critical business questions such as: How effective are the educational interventions under the Courage Naapi project? What feedback trends emerge from participants? Which areas require additional support or resources? It serves as a valuable tool for education professionals, program coordinators, and data analysts who aim to enhance learning experiences and optimize project outcomes through data-driven decision-making.
Frequently asked questions about this dashboard
What type of feedback does the Courage Naapi dashboard display?
The dashboard likely displays qualitative and quantitative feedback related to the educational project, helping stakeholders understand participant experiences and outcomes.
Who is the primary audience for the Courage Naapi dashboard?
The primary audience includes educators, program managers, and data analysts involved in the Courage Naapi educational project.
What business questions can this dashboard help answer?
It helps answer questions about the effectiveness of educational interventions, participant feedback trends, and areas needing improvement within the project.
Want a dashboard like this with your data?
We build a custom version for your business — US$ 50 per page, delivered within 7 calendar days.
Education Power BI templates
Complete projects built by the Excelverton factory: view them live with a free account and download the PBIP as a channel subscriber (1/month) or Pro subscriber (unlimited).
Create your free account
Save favorites, build collections and use the AI assistant — at no cost.