Cash Flow
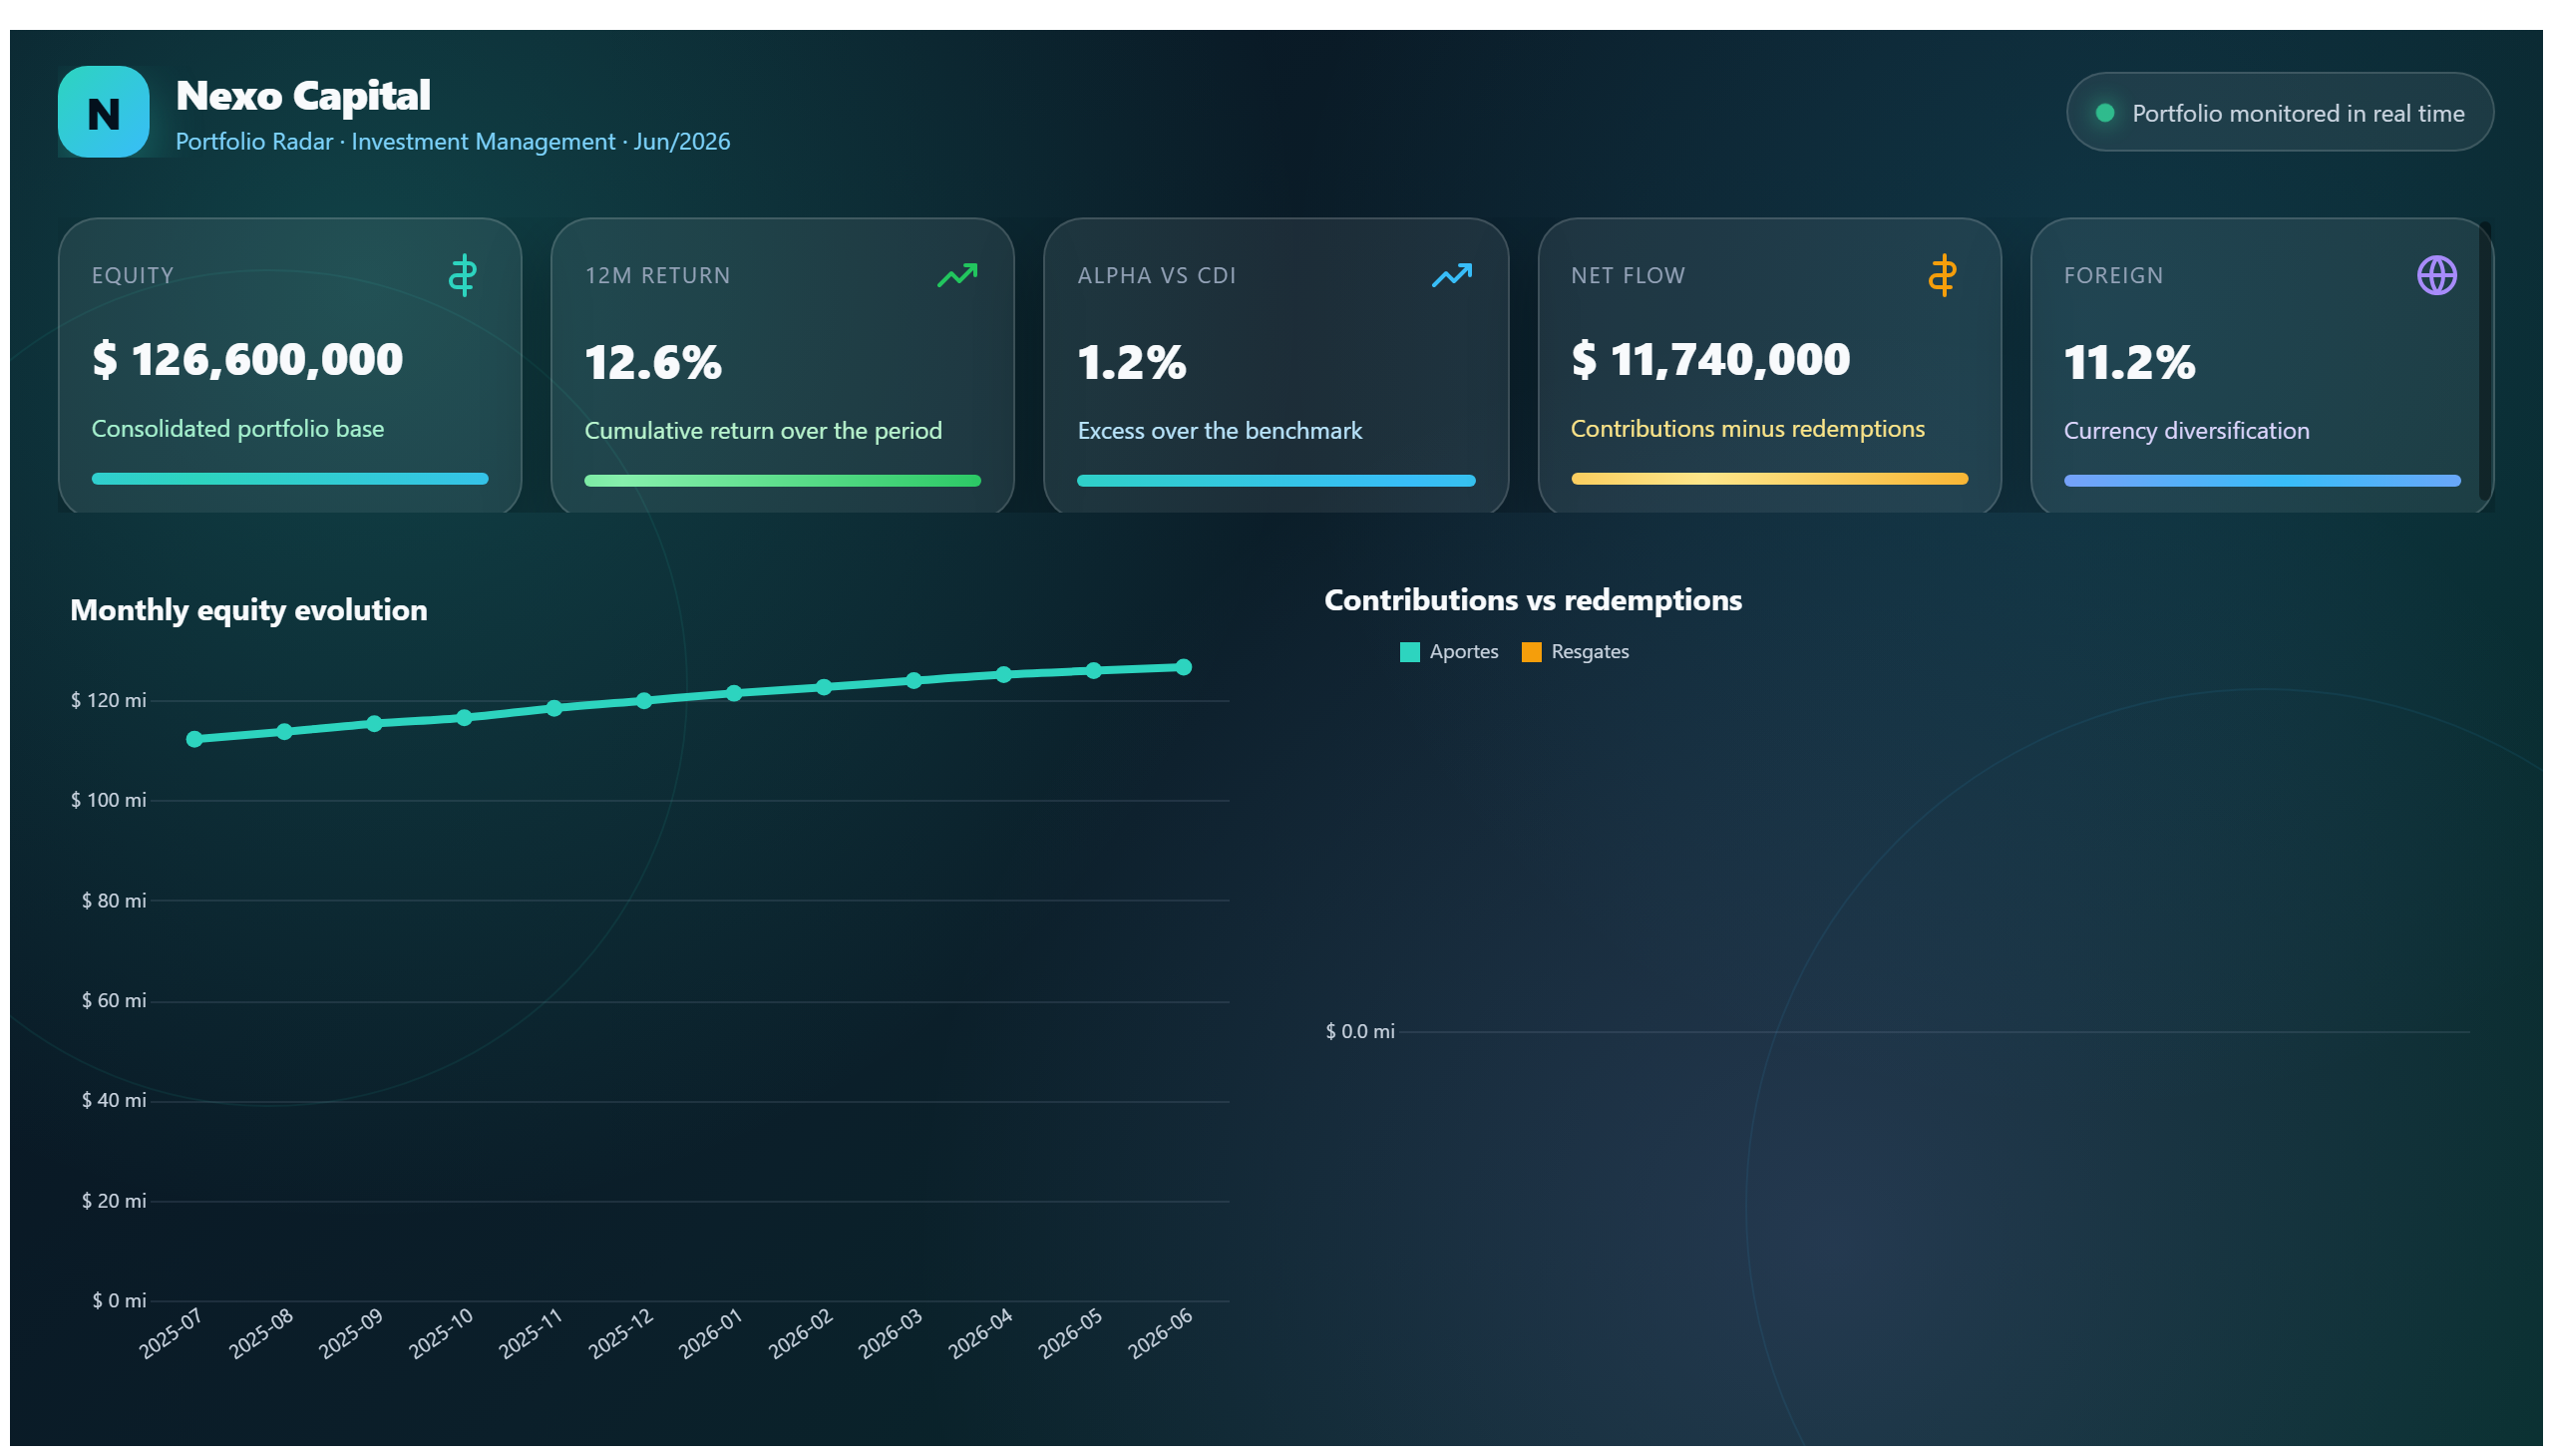
This report shows a company's cash flow, allowing visualization of financial inflows and outflows.
Create a free account
Save your favorite dashboards, get new templates by area and ask the AI assistant — for free.
About the Cash Flow dashboard
This is a free Power BI dashboard called Cash Flow, in the Financeiro domain. Explore KPIs, interactive visualizations and get inspired for your own data and business intelligence projects.
This report shows a company's cash flow, allowing visualization of financial inflows and outflows.
Dashboard analysis
The Cash Flow dashboard provides a comprehensive view of a company's financial inflows and outflows over a specified period. By visualizing the movement of cash, it enables users to understand how money enters and leaves the business, offering insights into liquidity and operational efficiency. This dashboard is essential for tracking the timing and amounts of cash transactions, helping to identify periods of surplus or shortage.
Business leaders and financial analysts can use this report to answer critical questions such as: Are there consistent cash inflows to support ongoing operations? When do major cash outflows occur, and how do they impact the company's financial health? The dashboard supports decision-making related to budgeting, investment, and managing working capital by highlighting trends and anomalies in cash movements.
Designed primarily for finance teams and executives, this dashboard simplifies complex financial data into clear visualizations, facilitating quick assessments and strategic planning. It is a valuable tool for maintaining financial stability and ensuring that the company can meet its obligations while pursuing growth opportunities.
Frequently asked questions about this dashboard
What types of cash transactions are displayed in this dashboard?
The dashboard shows both cash inflows, such as revenues and receivables, and cash outflows, including expenses and payments.
Can this dashboard help identify periods of cash surplus or shortage?
Yes, by visualizing the timing and amounts of cash movements, it highlights when the company experiences positive or negative cash flow.
Who is the primary audience for this Cash Flow dashboard?
The dashboard is intended for finance professionals and business executives responsible for managing and analyzing the company's financial health.
Want a dashboard like this with your data?
We build a custom version for your business — US$ 50 per page, delivered within 7 calendar days.
Finance Power BI templates
Complete projects built by the Excelverton factory: view them live with a free account and download the PBIP as a channel subscriber (1/month) or Pro subscriber (unlimited).
Create your free account
Save favorites, build collections and use the AI assistant — at no cost.