Gallery Deneb Grafico De barras
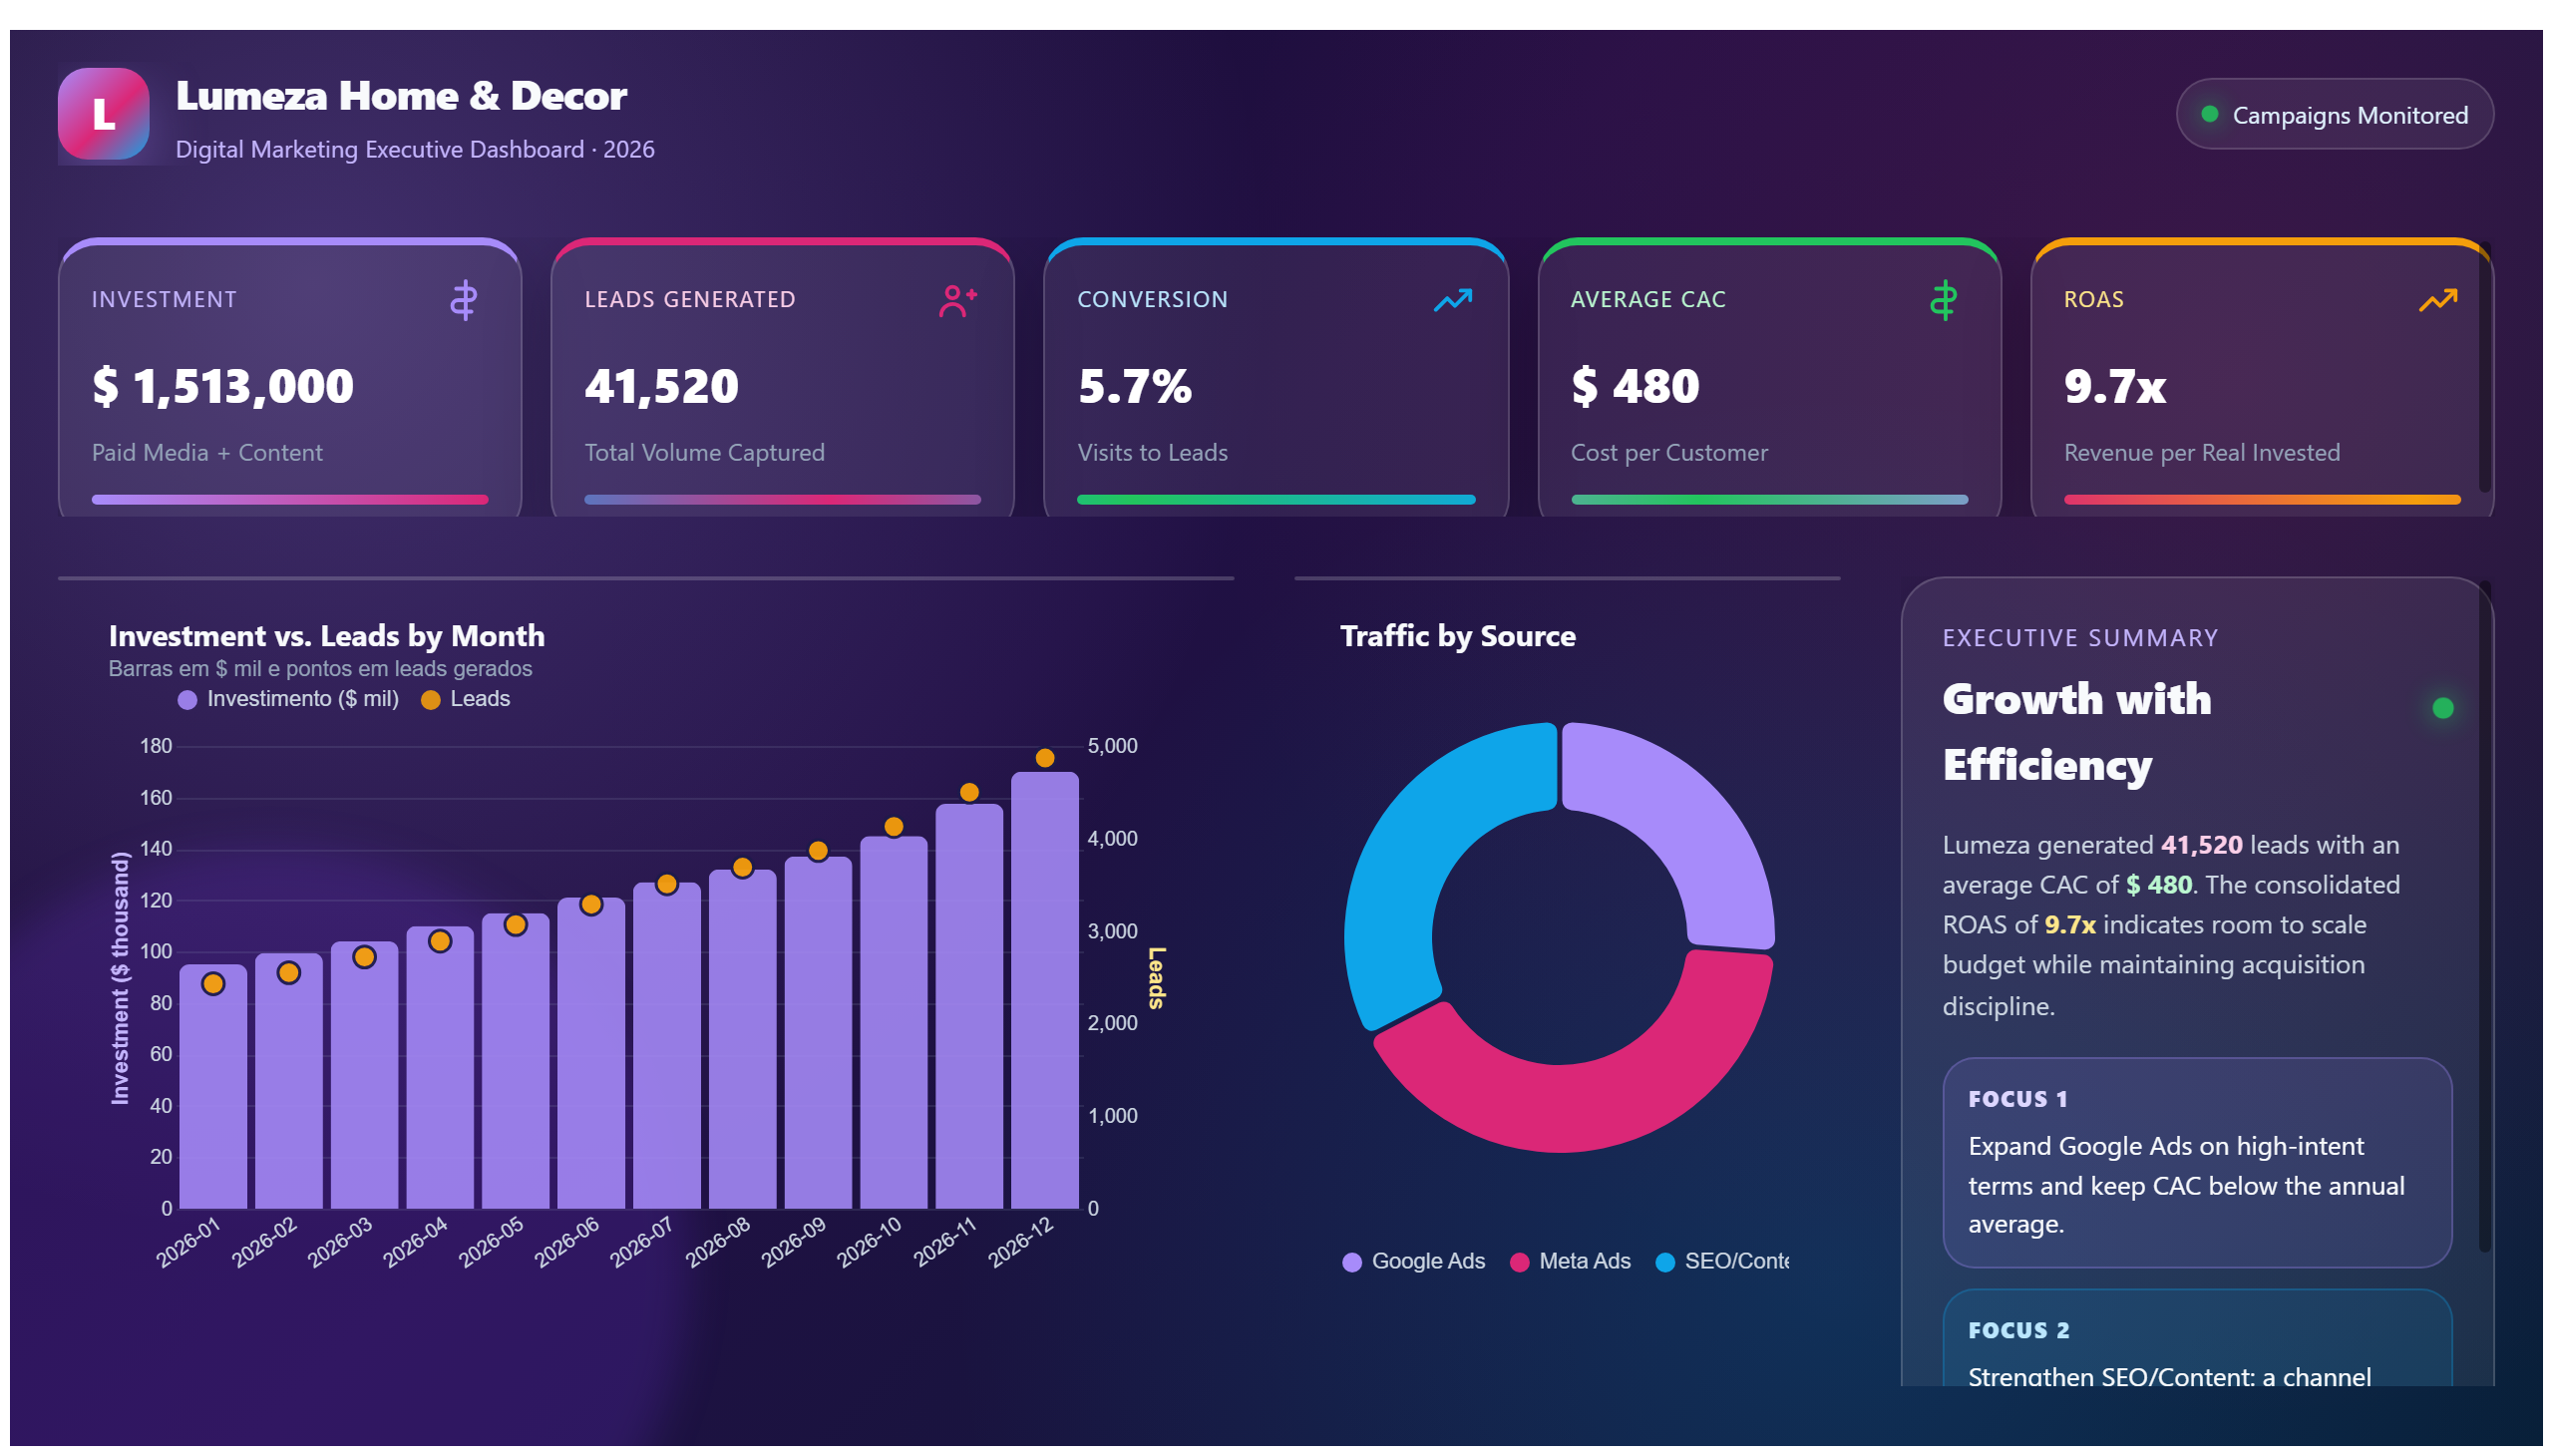
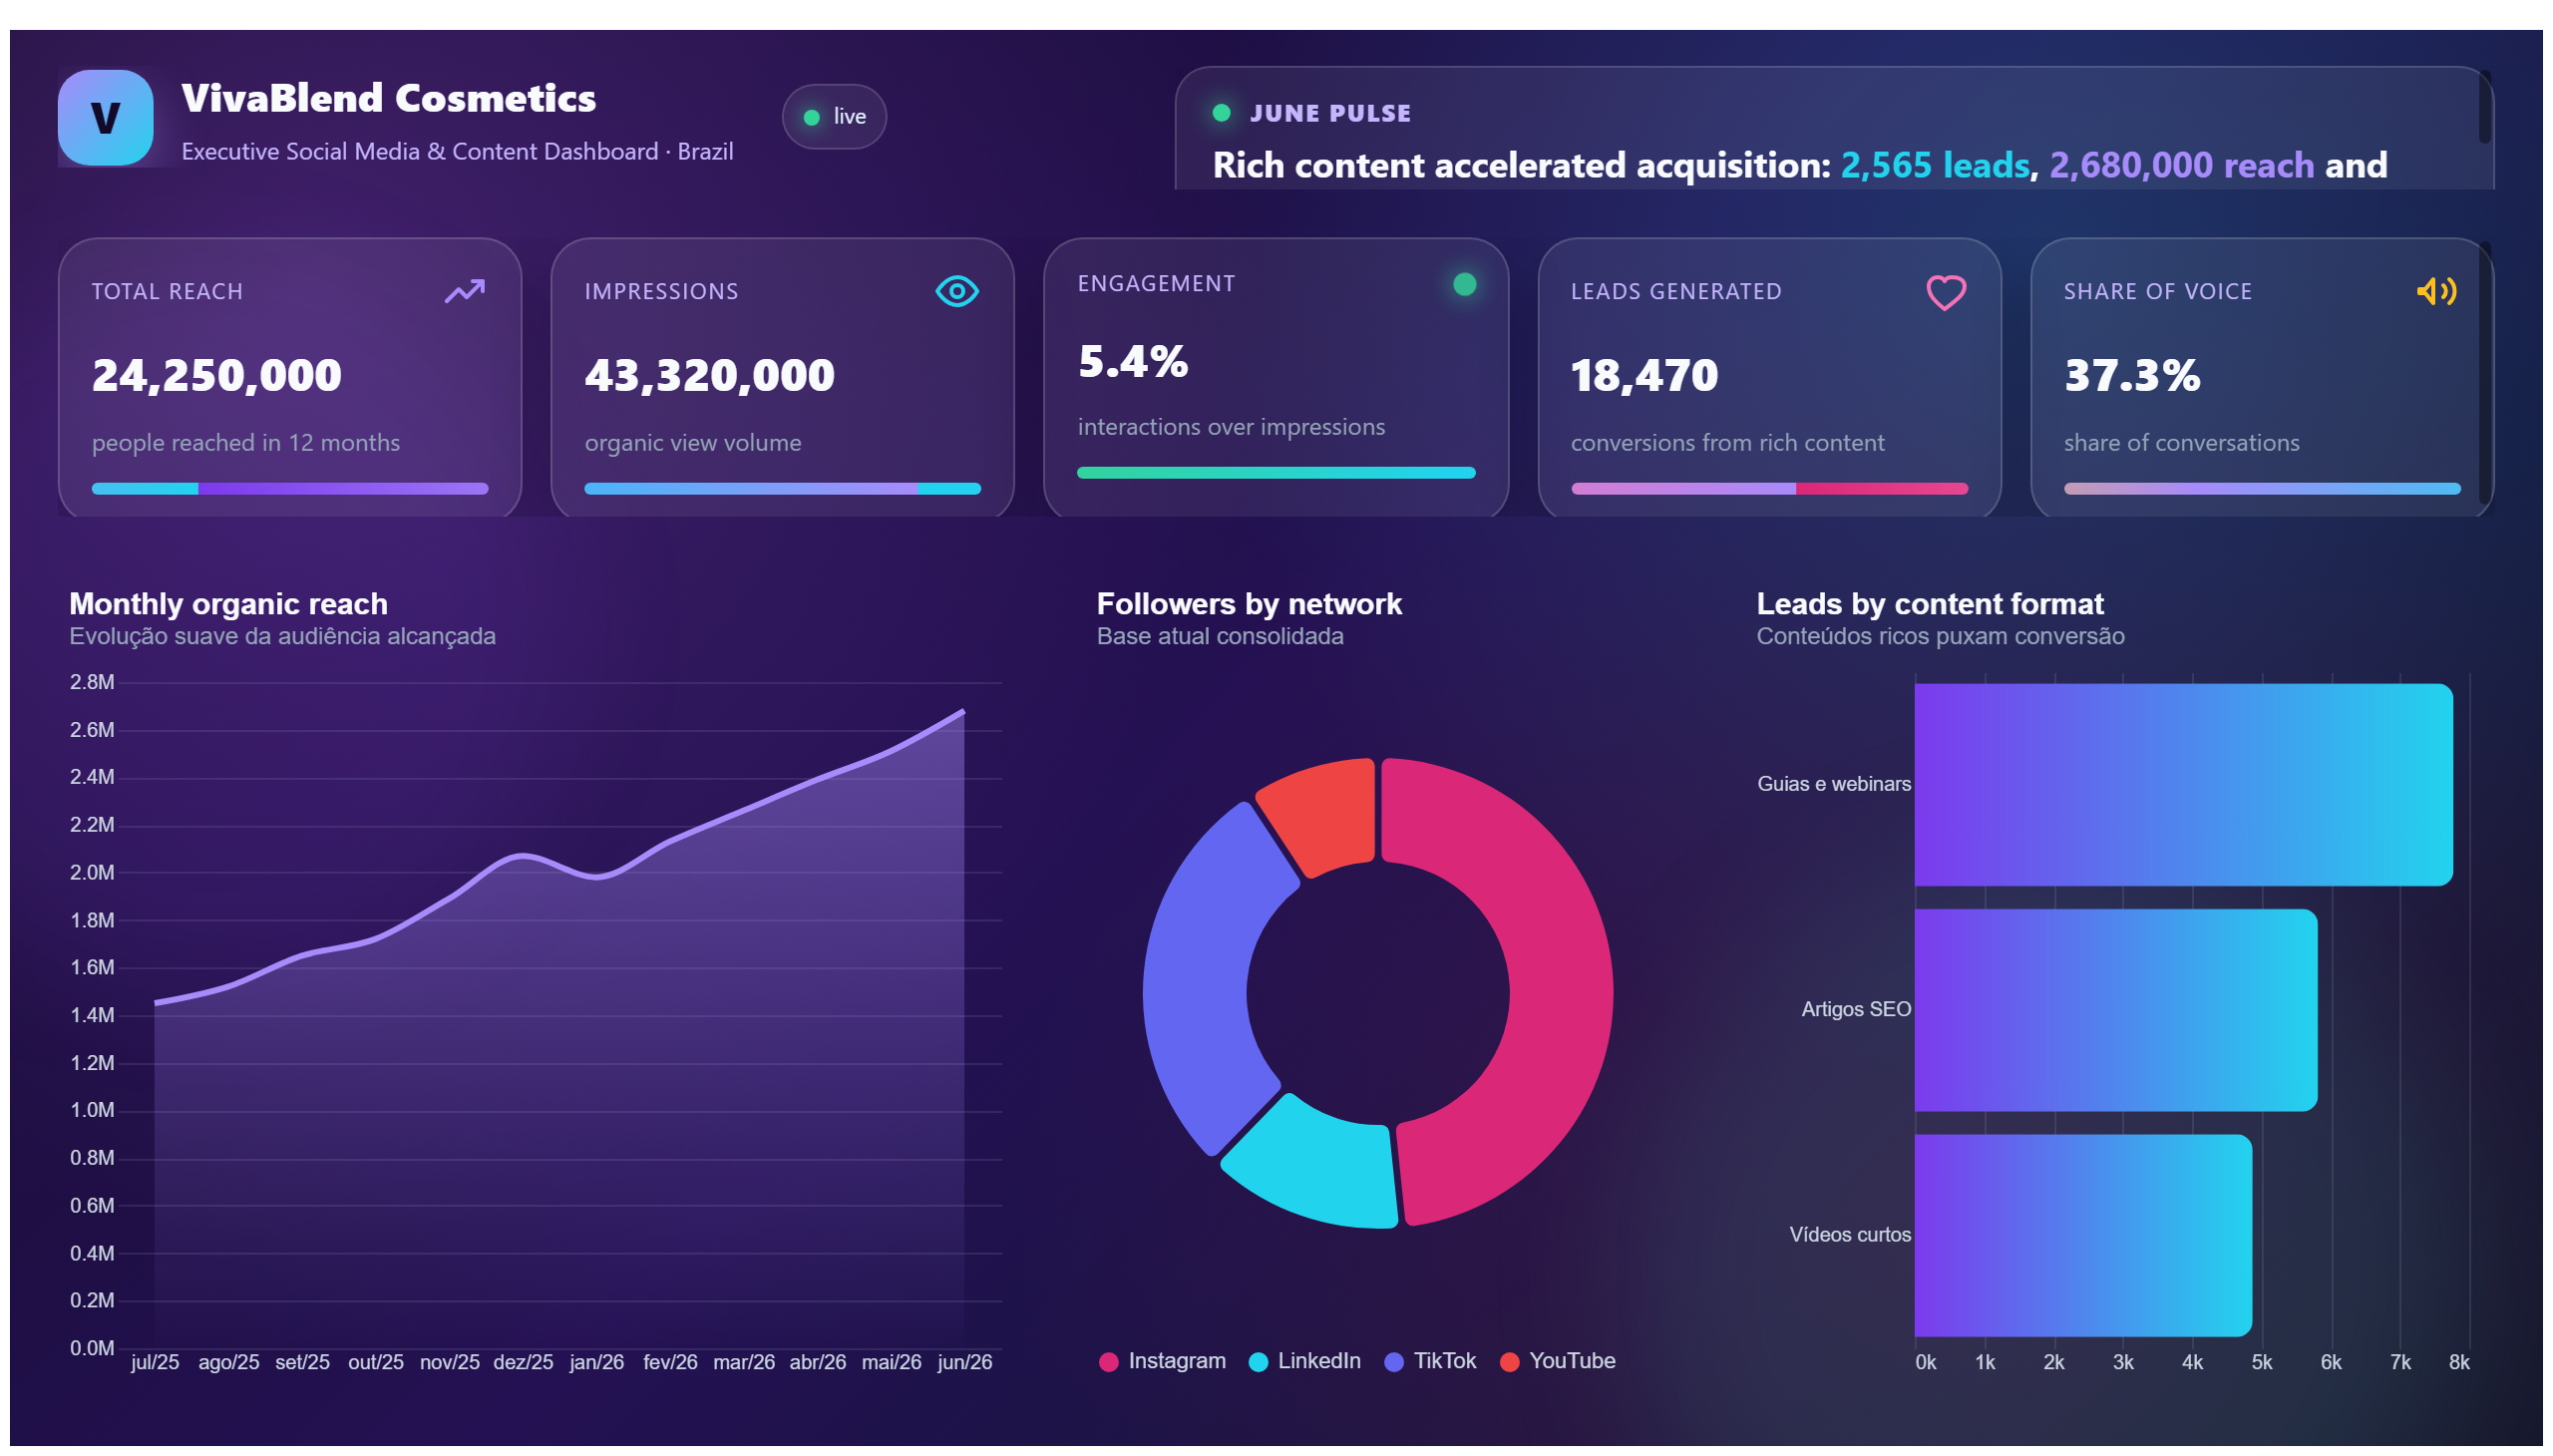
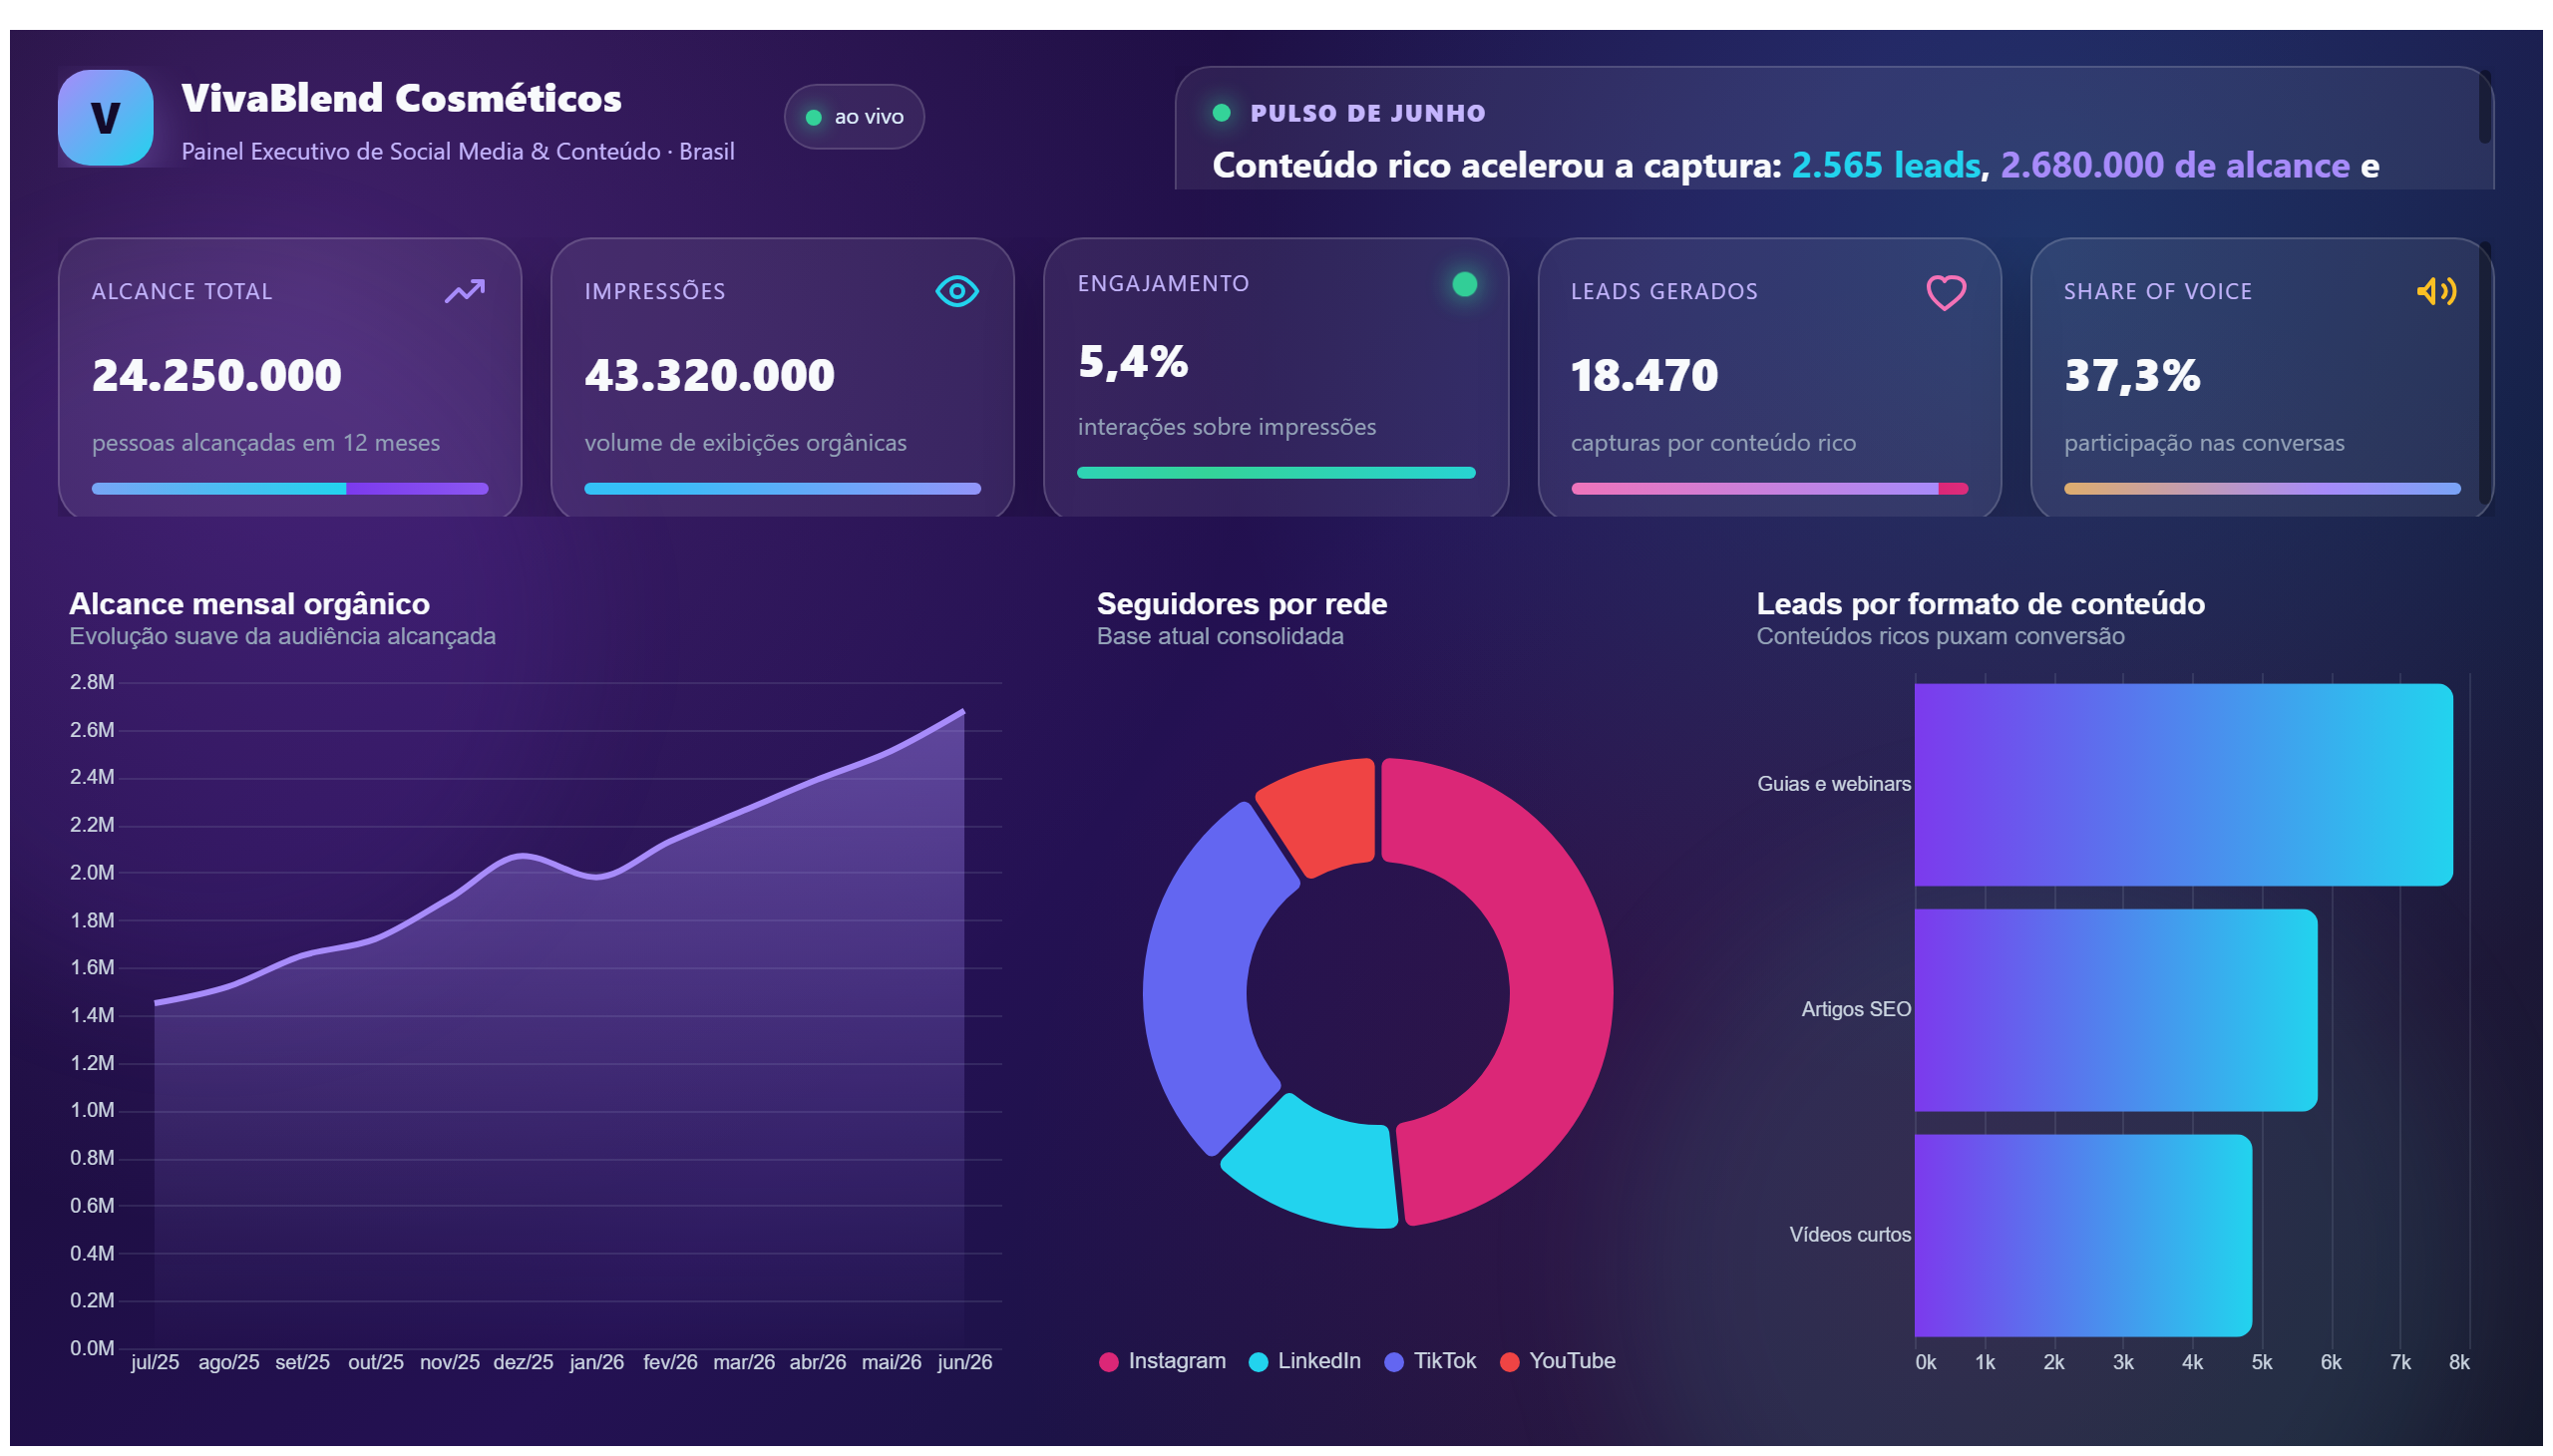
This report may show bar charts for analyzing marketing campaign performance.
This report analyzes churn rate and risks associated with customers who may leave the company.
Save your favorite dashboards, get new templates by area and ask the AI assistant — for free.
This is a free Power BI dashboard called Churn Dashboard and Risk Analysis, in the Marketing domain. Explore KPIs, interactive visualizations and get inspired for your own data and business intelligence projects.
This report analyzes churn rate and risks associated with customers who may leave the company.
The Churn Dashboard and Risk Analysis provides a comprehensive overview of customer churn rates and identifies potential risks associated with clients who may leave the company. Designed for marketing professionals and customer retention teams, this dashboard offers valuable insights into customer behavior, enabling data-driven decision making to reduce churn and improve customer loyalty.
By analyzing churn trends over time and segmenting customers based on risk factors, the dashboard answers critical business questions such as: Which customer segments are most likely to churn? What are the key indicators signaling potential customer loss? How can marketing strategies be adjusted to retain high-risk customers? The visualizations and metrics provided help organizations prioritize retention efforts and allocate resources effectively.
Overall, this dashboard serves as a strategic tool for marketing analysts, customer success managers, and business leaders focused on minimizing churn and maximizing customer lifetime value. It empowers teams to proactively identify at-risk customers and implement targeted interventions to sustain growth.
The dashboard utilizes churn rate trends, customer segmentation by risk levels, and behavioral indicators to highlight clients who are likely to leave.
Marketing professionals, customer retention teams, and business leaders aiming to reduce churn and improve customer loyalty.
By identifying high-risk customer segments and analyzing churn drivers, the dashboard enables targeted marketing actions and resource allocation to retain those customers.
We build a custom version for your business — US$ 50 per page, delivered within 7 calendar days.
Explore more Power BI dashboards from the same domain to compare KPIs, layouts and analytics models.
This report may show bar charts for analyzing marketing campaign performance.
This report may present metrics of Facebook ads, helping to evaluate advertising campaigns.
Report on pay-per-click ads, analyzing campaign effectiveness.
This report provides a summary of the Hollywood theatrical market between 1995 and 2021.
Complete projects built by the Excelverton factory: view them live and download the PBIP — 1 free downloads every 30 days with a free account, unlimited on Pro.
Save favorites, build collections and use the AI assistant — at no cost.